Fig. 11.
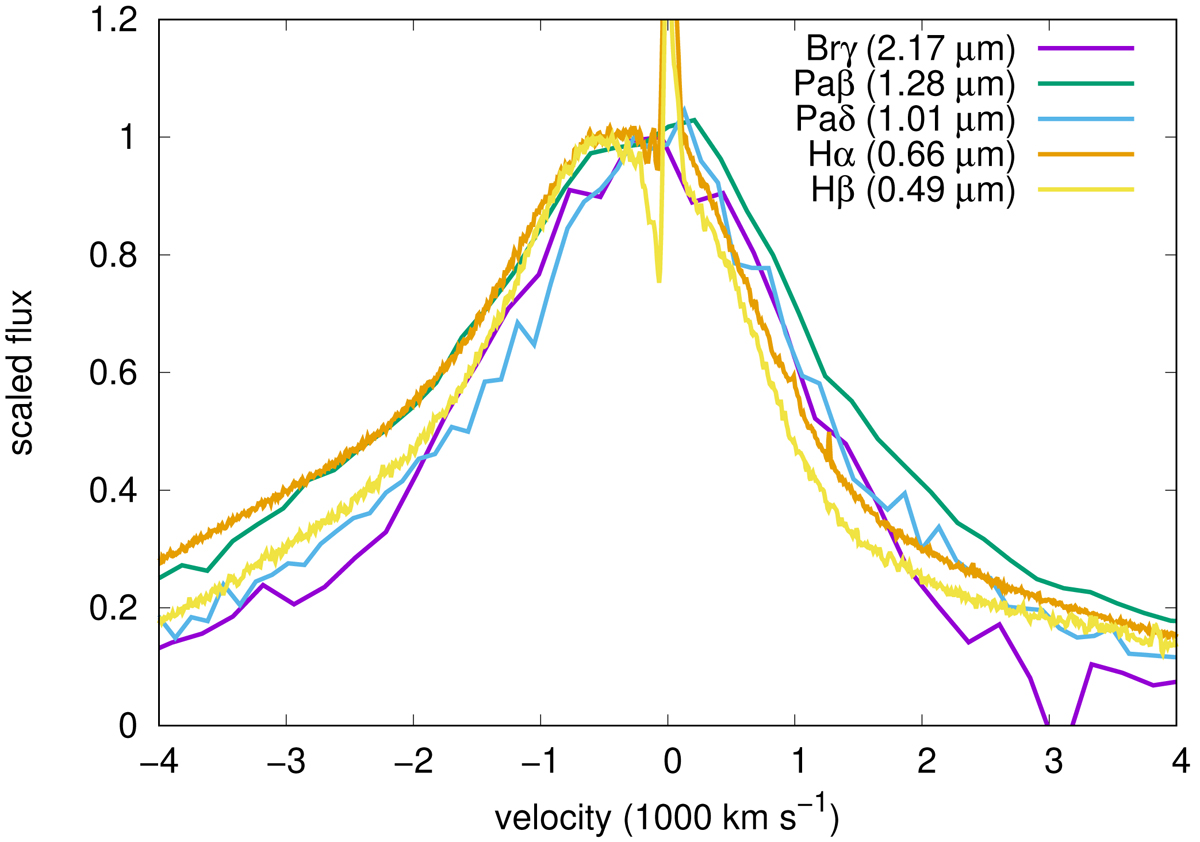
Peak of the hydrogen emission lines. We use the optical spectrum at +67 d and the NIR spectrum at +69 d. The peak of the broad component does not show a wavelength-dependent shift expected if dust is formed at the emission line forming region, i.e., the emission lines at the shorter wavelengths to have more blue-shifted peaks. The flux is normalized to match the emission peak.
Current usage metrics show cumulative count of Article Views (full-text article views including HTML views, PDF and ePub downloads, according to the available data) and Abstracts Views on Vision4Press platform.
Data correspond to usage on the plateform after 2015. The current usage metrics is available 48-96 hours after online publication and is updated daily on week days.
Initial download of the metrics may take a while.