Fig. 10.
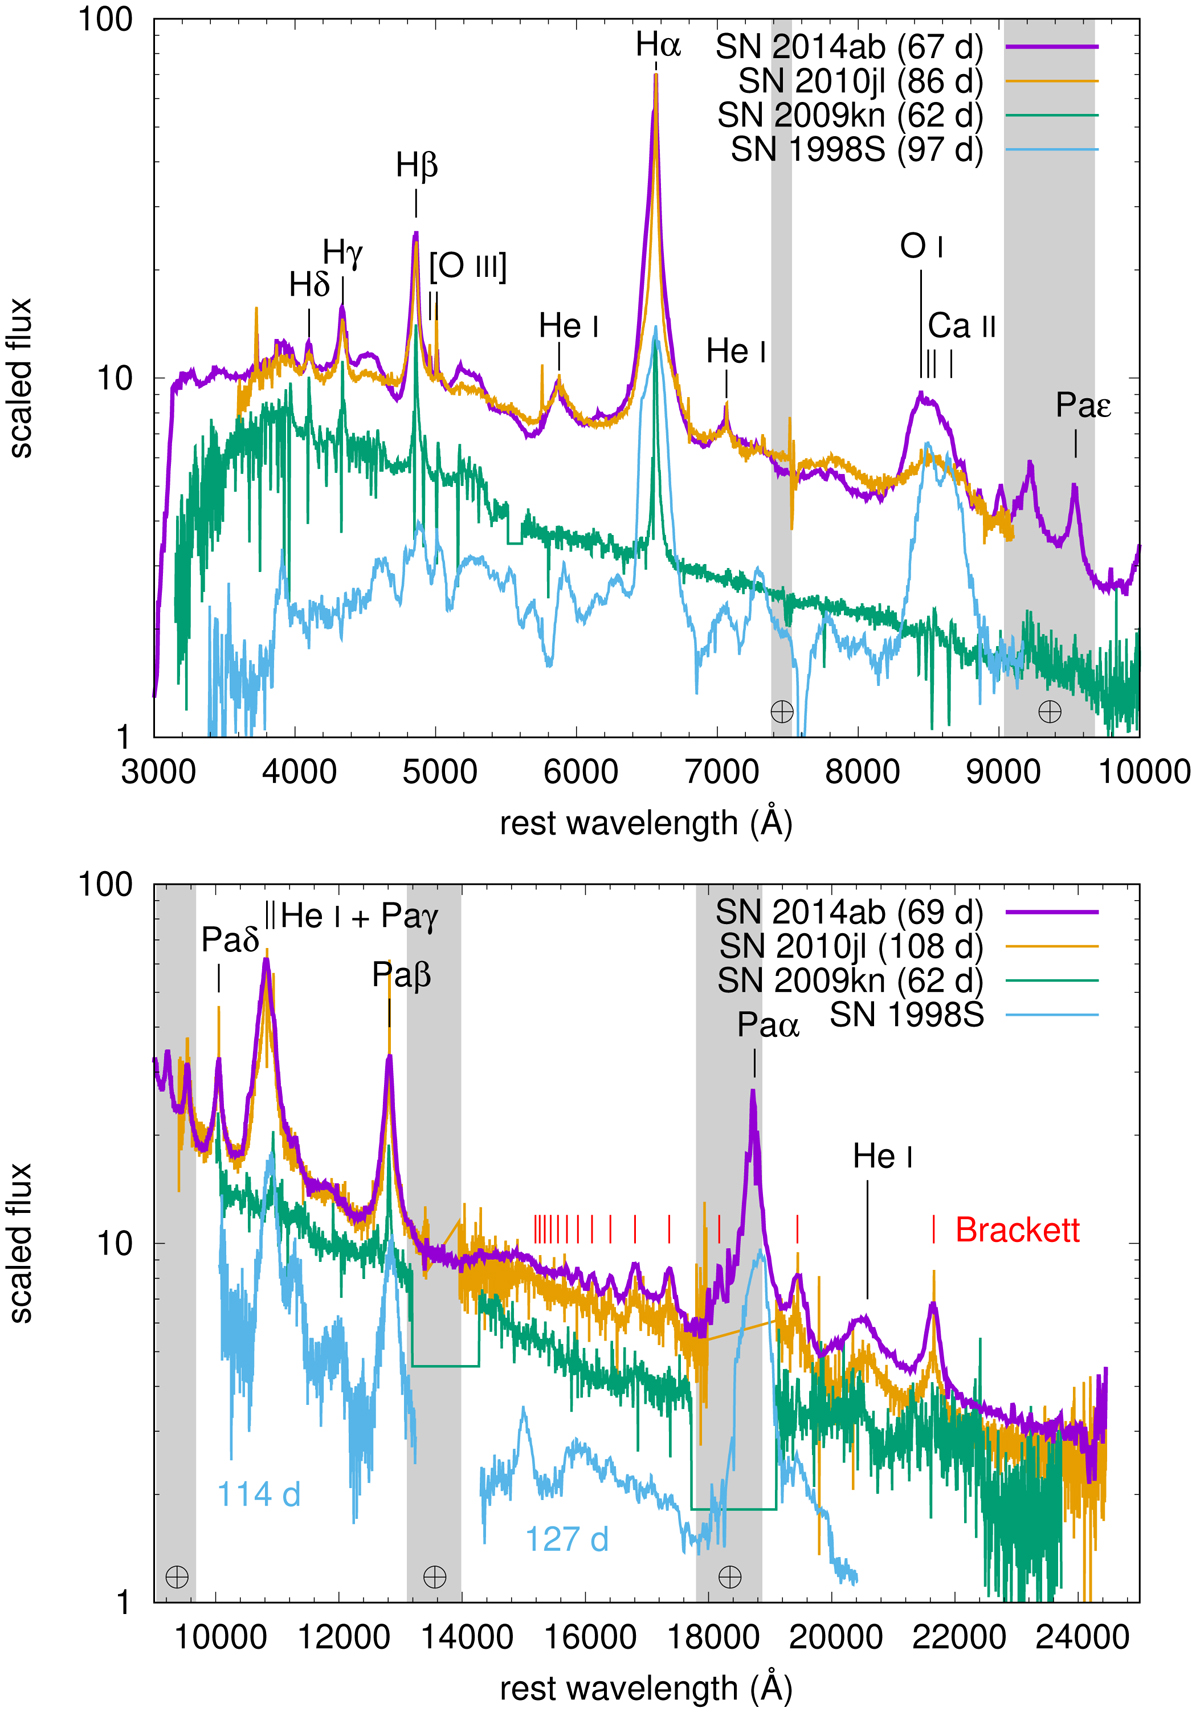
Comparison of our +67 d visual-wavelength (top) and NIR-wavelength (bottom) spectrum of SN 2014ab with other SN IIn subtypes. Comparison objects are the slowly declining SN 2010jl (Borish et al. 2015), the 1994W-like SN 2009kn (Kankare et al. 2012), and the rapid-declining SN 1998S (Fassia et al. 2001). Prominent ions are indicated and labeled. Regions suffering from strong telluric lines are shaded. Note that the NIR spectrum of SN 1998S is composed of data taken on two different but close in time epochs as indicated. Note that the previously unpublished visual-wavelength spectrum of SN 2010jl was obtained by the CSP-II (see Appendix B for details).
Current usage metrics show cumulative count of Article Views (full-text article views including HTML views, PDF and ePub downloads, according to the available data) and Abstracts Views on Vision4Press platform.
Data correspond to usage on the plateform after 2015. The current usage metrics is available 48-96 hours after online publication and is updated daily on week days.
Initial download of the metrics may take a while.