Fig. 1.
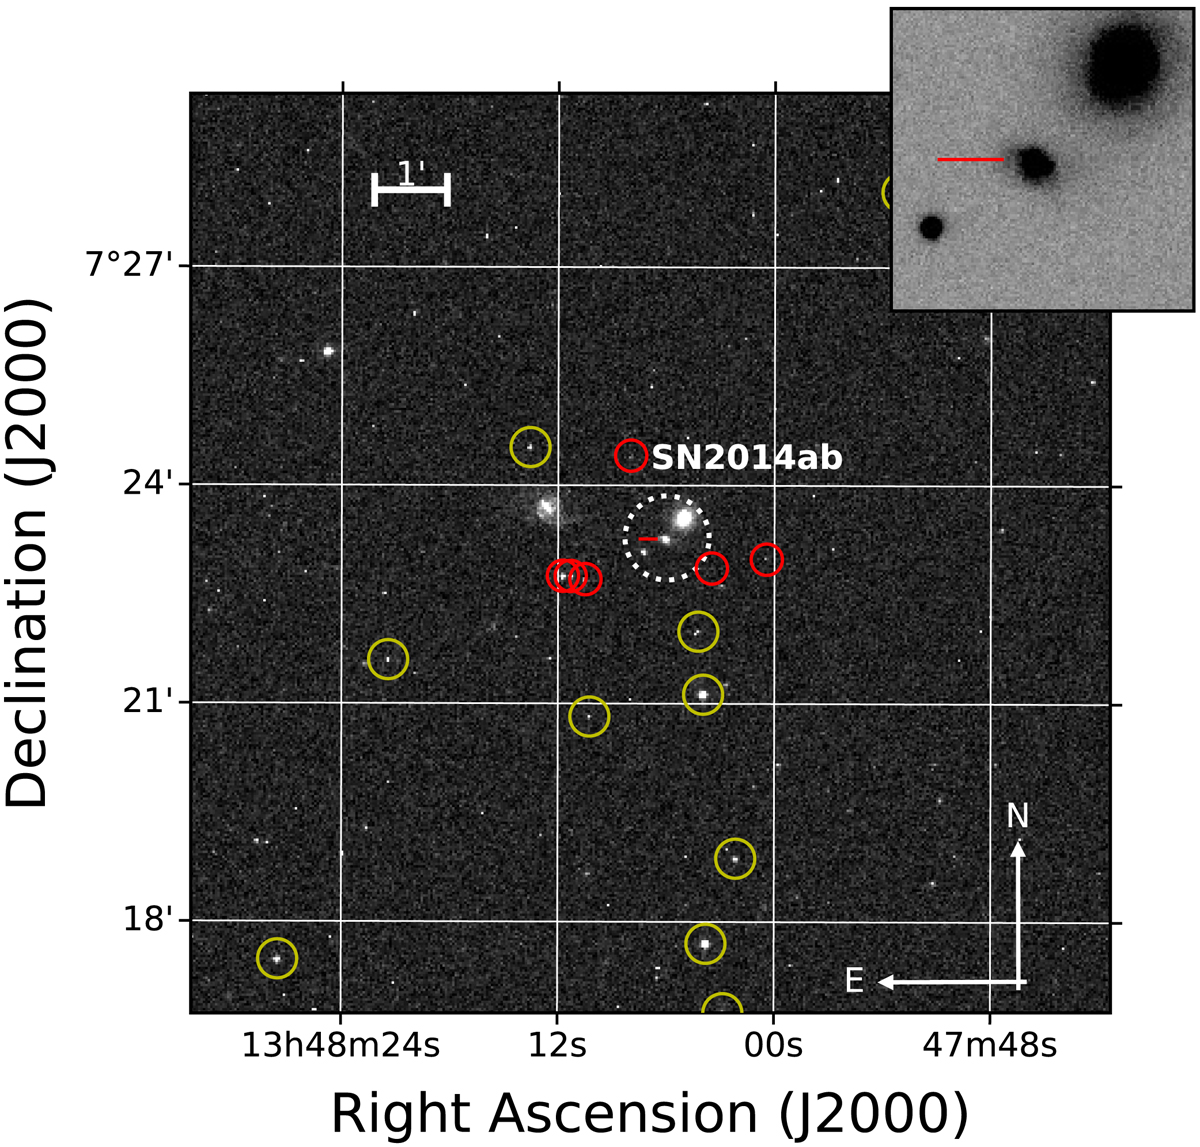
Finding chart constructed using a single r-band image obtained on 03 March 2014 with the Swope 1.0 m telescope. The position of SN 2014ab is indicated with a dotted circle and the approximate area contained within the circle is shown in the upper right inset Optical and NIR local sequence stars are indicated with yellow and red circles, respectively.
Current usage metrics show cumulative count of Article Views (full-text article views including HTML views, PDF and ePub downloads, according to the available data) and Abstracts Views on Vision4Press platform.
Data correspond to usage on the plateform after 2015. The current usage metrics is available 48-96 hours after online publication and is updated daily on week days.
Initial download of the metrics may take a while.