Fig. 5
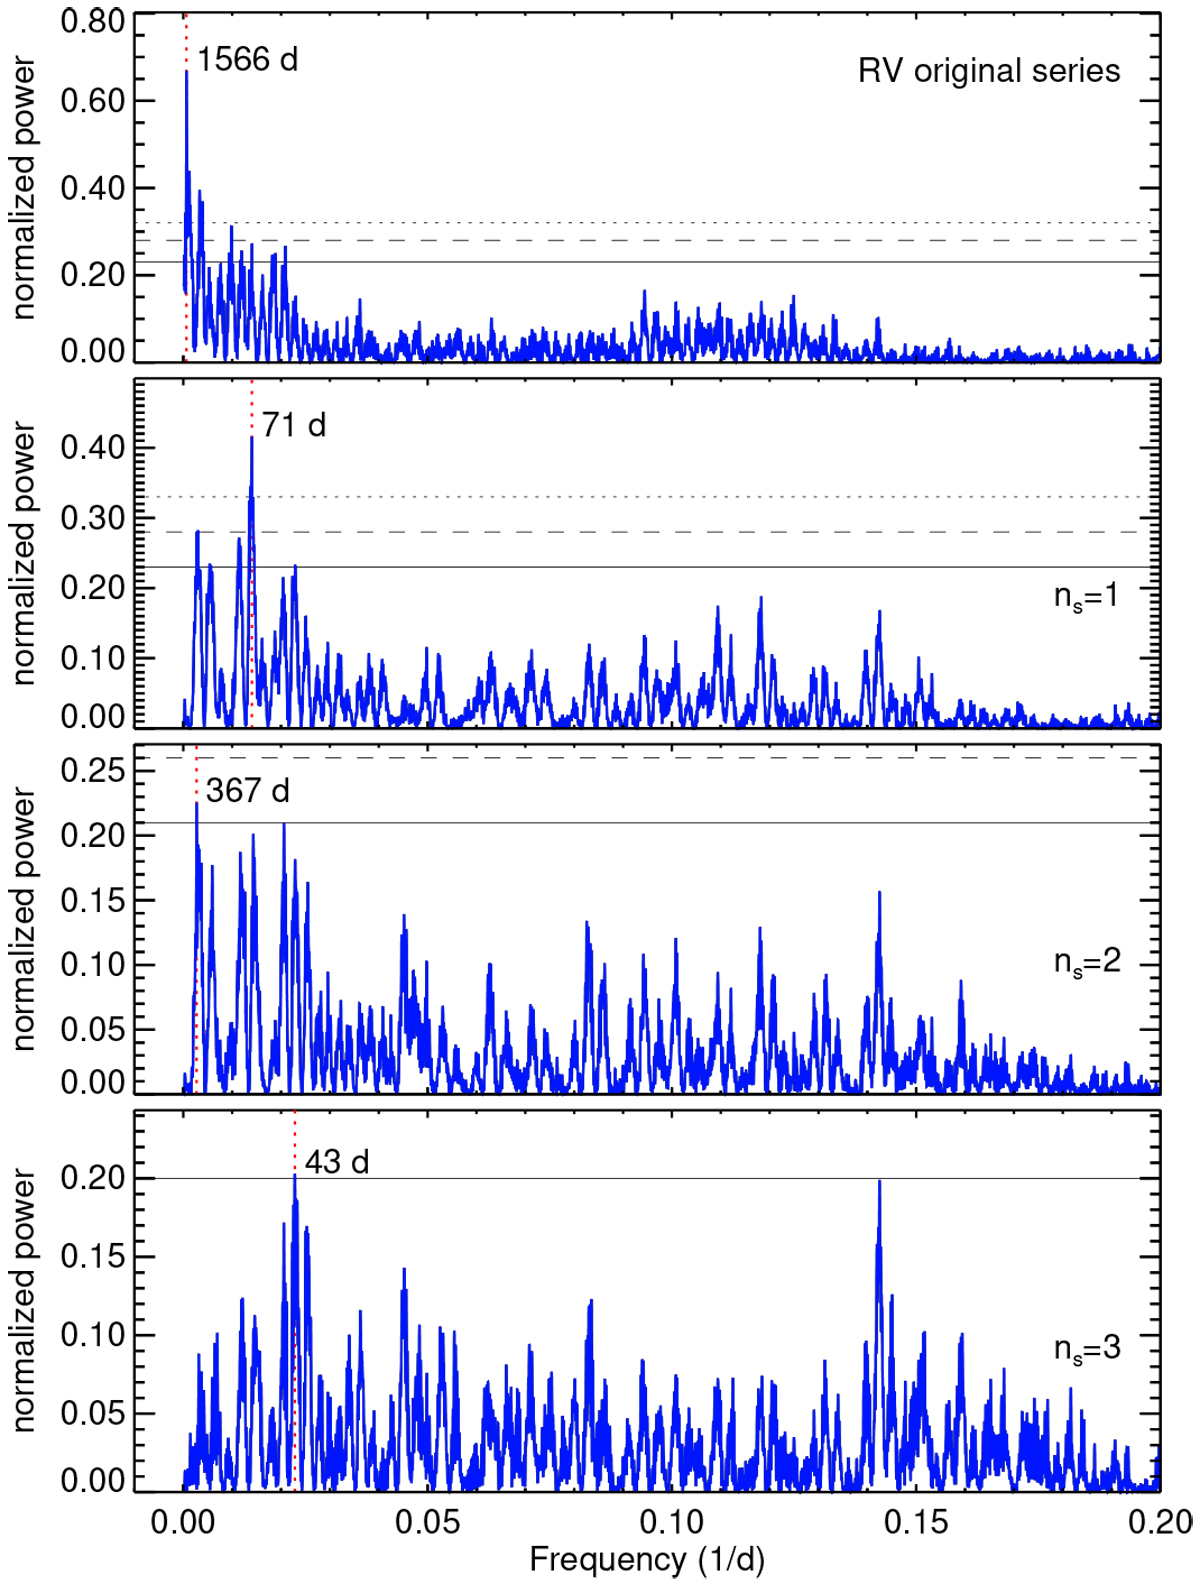
Generalised Lomb-Scargle periodogram of the HARPS and HARPS-N data of BD-11 4672 (top panel) and the residuals obtained after removing the ns−signals best-fit solution (second to fourth panels). In each panel, the periodogram’s most significant frequency is identified by a vertical dotted red line and labeled by its corresponding period, while the horizontal solid, dashed and dotted lines respectively identify the 10, 1, and 0.1% FAP levels.
Current usage metrics show cumulative count of Article Views (full-text article views including HTML views, PDF and ePub downloads, according to the available data) and Abstracts Views on Vision4Press platform.
Data correspond to usage on the plateform after 2015. The current usage metrics is available 48-96 hours after online publication and is updated daily on week days.
Initial download of the metrics may take a while.