Fig. 3
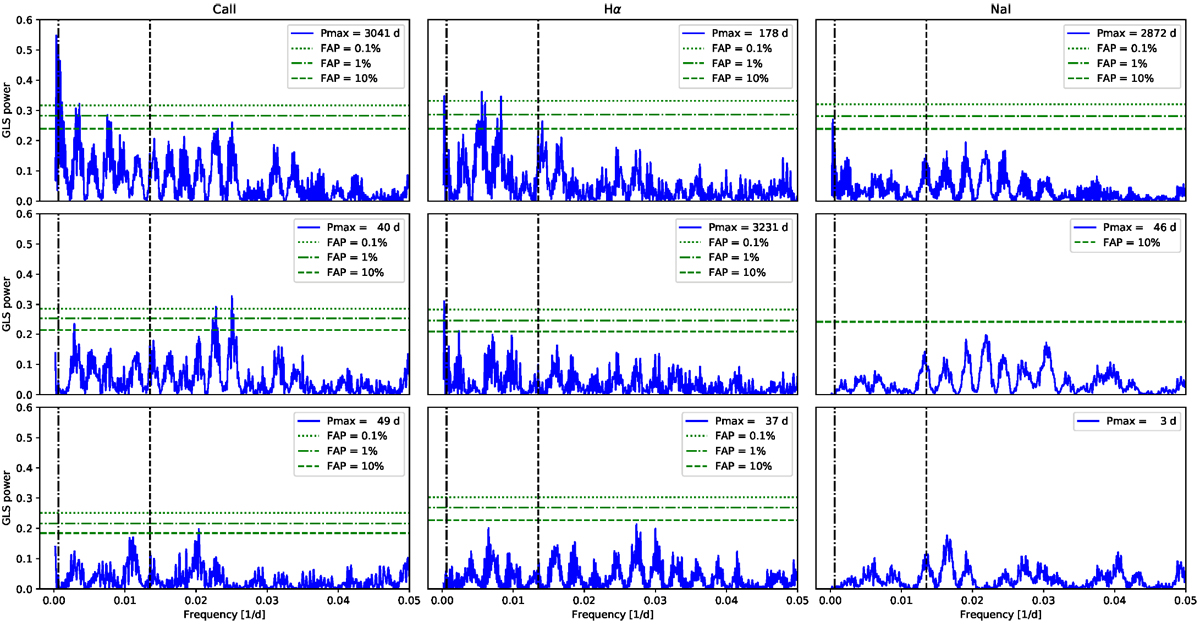
Generalised Lomb-Scargle periodograms of the activity indices time series (top row) and residuals after pre-whitening (middle and bottom rows). The period value of the principal peak of each periodogram is noted in the legend as Pmax, and the dashed and dot-dashed black vertical lines indicates the signals discussed in Sect. 3.2. The horizontal green lines indicates the false alarm probability (FAP) levels, as indicated in the legend. The FAP levels are computed via 10 000-iterations bootstrap. In the residuals periodograms only the FAP levels less significant than the principal peak of the previous periodograms are marked.
Current usage metrics show cumulative count of Article Views (full-text article views including HTML views, PDF and ePub downloads, according to the available data) and Abstracts Views on Vision4Press platform.
Data correspond to usage on the plateform after 2015. The current usage metrics is available 48-96 hours after online publication and is updated daily on week days.
Initial download of the metrics may take a while.