| Issue |
A&A
Volume 641, September 2020
|
|
|---|---|---|
| Article Number | A111 | |
| Number of page(s) | 18 | |
| Section | Extragalactic astronomy | |
| DOI | https://doi.org/10.1051/0004-6361/202037945 | |
| Published online | 18 September 2020 | |
Relations among structural parameters in barred galaxies with a direct measurement of bar pattern speed
1
Dipartimento di Fisica e Astronomia “G. Galilei”, Universitä di Padova, Vicolo dell’Osservatorio 3, 35122 Padova, Italy
e-mail: This email address is being protected from spambots. You need JavaScript enabled to view it.
2
Instituto de Astronomía y Ciencias Planetarias, Universidad de Atacama, Avenida Copayapu 485, Copiapó, Chile
3
Departamento de Astrofísica, Universidad de La Laguna, Avenida Astrofísico Francisco Sánchez s/n, 38206 La Laguna, Tenerife, Spain
4
Instituto de Astrofísica de Canarias, Calle Vía Láctea s/n, 38205 La Laguna, Tenerife, Spain
5
INAF – Osservatorio Astronomico di Padova, Vicolo dell’Osservatorio 2, 35122 Padova, Italy
6
Jeremiah Horrocks Institute, University of Central Lancashire, PR1 2HE Preston, UK
Received:
12
March
2020
Accepted:
2
July
2020
Abstract
We investigate the relations between the properties of bars and their host galaxies in a sample of 77 nearby barred galaxies, spanning a wide range of morphological types and luminosities, with 34 SB0-SBa and 43 SBab-SBc galaxies. The sample includes all the galaxies with reliable direct measurement of their bar pattern speed based on long-slit or integral-field stellar spectroscopy using the Tremaine-Weinberg method. We limited our analysis to the galaxies with a relatively small relative error on the bar pattern speed (≤50%) and that do not host an ultrafast bar. For each galaxy, we collected the radius, strength, pattern speed, corotation radius, and rotation rate for the bar and we also collected the Hubble type and absolute SDSS r-band magnitude. We also used literature bulge-to-total luminosity ratios for a subsample of 53 galaxies with an available photometric decomposition. We confirmed earlier observational findings that longer bars rotate at lower bar pattern speeds, shorter bars are weaker, and bars with a low rate of bar rotation rotate at faster bar pattern speeds and have smaller corotation radii. In addition, we found that stronger bars rotate at lower bar pattern speeds, as predicted from the interchange of angular momentum during bar evolution, which in turn may depend on different galaxy properties. Moreover, we report that brighter galaxies host longer bars, which rotate at lower bar pattern speeds and have larger corotation radii. This result is in agreement with a scenario of downsizing in bar formation, if more massive galaxies formed earlier and had sufficient time to slow down, grow in length, and push corotation outwards.
Key words: galaxies: general / galaxies: evolution / galaxies: structure / galaxies: kinematics and dynamics / galaxies: statistics
© ESO 2020
1. Introduction
Bars are common in the local Universe across a wide range of galaxy morphologies (e.g. Aguerri et al. 2009; Buta et al. 2015), luminosities (e.g. Méndez-Abreu et al. 2010; Erwin 2018), and environments (e.g. Méndez-Abreu et al. 2012; Lin et al. 2014). The photometric, kinematic, and dynamical properties of bars have been studied extensively (e.g. Debattista et al. 2005; Gadotti 2011): their formation mechanisms and evolutionary processes include the interchange of angular momentum (e.g. Debattista & Sellwood 2000; Athanassoula 2003; Berentzen et al. 2004; Sellwood & Debattista 2006; Sellwood 2006; Villa-Vargas et al. 2010; Athanassoula et al. 2013; Łokas et al. 2014).
According to their overall shape and in addition to the classical bar morphology characterised by a smooth light distribution, bar-like features can also have an ansae-type morphology with a light concentration at each end (e.g. Laurikainen et al. 2007; Martinez-Valpuesta et al. 2007). Bars can be roughly divided into “flat” and “exponential” based on their surface brightness radial profile. A flat bar has a flatter profile than the surrounding disc, whereas the profile of an exponential bar is more similar to that of the disc (Elmegreen & Elmegreen 1985; Elmegreen et al. 1996). Flat bars are more typical of early-type barred galaxies (ETBGs, with Hubble stage ranging between T = 1 to 5) rather than late-type barred galaxies (LTBGs, with T between 5 and 7) and can exhibit isophotal twists (Elmegreen & Elmegreen 1985). In particular, exponential profiles are typical in LTBGs with T ≥ 5, while flat ones are prevalent in systems with T < 5, as shown by Díaz-García et al. (2016a) using near-infrared imaging of the S4G survey (Sheth et al. 2010). Moreover, the profiles change according to the mass, as studied by Kruk et al. (2018) using the GalaxyZoo project (Lintott et al. 2008). Low-mass, disc-dominated galaxies have bars with an almost exponential light profile, while high-mass galaxies with a prominent bulge have bars with a flat profile.
The primary parameters describing a bar are its radius Rbar, strength Sbar, pattern speed Ωbar, and rotation rate ℛ. The radius and strength of the bar are structural parameters and can be recovered from the analysis of optical and/or near-infrared images, while the pattern speed and rotation rate of the bar are dynamical parameters and their determination requires kinematics.
The relations between the properties of bars and their host galaxies have also been widely explored. Early findings include the results by Elmegreen & Elmegreen (1985), who found that bars in ETBGs are longer than those in LTBGs, and by Athanassoula & Martinet (1980), who observed that galaxies with smaller bulges also have shorter bars. Kim et al. (2016a) investigated the relations between the properties of bars and those of the inner parts of their host discs based on near-infrared Spitzer data. They found that among massive galaxies (M* > 1010 M⊙), longer bars reside in more flattened inner discs (i.e. discs with larger inner scalelengths and lower central surface brightnesses) than shorter bars. Moreover, these bars are often associated with a light deficit in the disc surrounding them. This deficit turns out to be more pronounced with longer bars and/or in galaxies with a higher bar-to-total luminosity ratio at all the explored masses (109 < M* < 1011 M⊙). By performing a bi-dimensional decomposition on multiband SDSS images of 700 galaxies, Sanchez-Janssen & Gadotti (2013) found that barred discs tend to have fainter central surface brightness, and larger disc scalelengths h than unbarred galaxies of the same stellar mass (M* > 1010 M⊙). Barred galaxies appear to be more extended than the unbarred counterparts (Erwin 2019). Consolandi (2016) found that massive spiral galaxies harbour red and dead bars, which become even redder with increasing galaxy mass. Aguerri (1999) found that global star formation activity is enhanced when a galaxy hosts a strong bar. Several studies have been devoted to this subject, and have drawn conflicting conclusions (e.g. Wang et al. 2020). Star formation in strongly barred galaxies resulted to be significantly lower than in unbarred galaxies (Kim et al. 2017), while an almost complete suppression of the star formation in the bar region is often associated with its increase both at the centre of the bar and in a ring just outside it, implying that the gas is redistributed by the bar (James & Percival 2018; Neumann et al. 2020).
Díaz-García et al. (2016a,b) studied the shapes of bars. In lenticular and low-mass objects (M* < 109 M⊙), bars are oval in shape, while in early- and intermediate-type spirals (0 < T ≤ 5) bars are narrower than in later types. However, the shape of bars among ETBGs can be rounded by the presence of a bulge and/or barlens. The discussion on the strength of bars is controversial because Sbar strongly depends on the method used to measure it (Lee et al. 2019). Díaz-García et al. (2016b) suggested that more massive ETBGs (M* > 109 M⊙) host stronger bars, defined assuming the bar Fourier density amplitudes. These bars are characterised by more disc-like inner isophotes as well. These results agree with a scenario whereby intermediate barred galaxies (T = 5) move in the Hubble sequence towards earlier types, while bars trap stars from the disc and become narrower and stronger (Kormendy 2013). This scenario is supported by the findings that bars in ETBGs are longer (both in physical units and relative to the disc) and have higher values of Sbar, as measured by the bar Fourier density amplitudes, than later types (3 < T ≤ 5). Bars in ETBGs seem to be on average stronger than those in LTBGs, even when Sbar is determined by visual inspection (Lee et al. 2019). On the other hand, Menéndez-Delmestre et al. (2007) found a similar distribution in the mean bar ellipticity, adopted as estimate of Sbar, in ETBGs and LTBGs, so that Sbar appears uncorrelated with the Hubble type. Erwin (2005) showed that bars in ETBGs are larger than bars in LTBGs, but this is also true for relative sizes (for example when considering Rbar relative to the radius of the isophote with 25 mag arcsec−2 in B-band R25 or to h). Moreover, ETBGs present a strong correlation between Rbar and disc size, but this correlation disappears in LTBGs. When split according to a morphological classification, strong and weak bars in ETBGs differ primarily in ellipticity, while they have very similar sizes. However, strong bars in LTBGs are on average twice the size of weak bars. These conclusions were partially revised with the advent of the S4G survey (e.g. Herrera-Endoqui et al. 2015; Díaz-García et al. 2016a,b; Erwin 2019). Díaz-García et al. (2016a) found that bars in LTBGs (T > 5) are unexpectedly long with respect to both R25 and h, while their physical sizes are small. The bar ellipticity decreases from T = 0 towards earlier types, as found by Laurikainen et al. (2007), whereas the maximum ellipticity remains nearly constant along the Hubble sequence (as in Marinova & Jogee 2007).
The structural and dynamical evolution of a barred galaxy is driven by Ωbar. This is the angular speed of the bar and determines how far from the galaxy centre the bar affects the orbits of stars. It is parametrised by the bar rotation rate ℛ ≡ Rcr/Rbar, which is the ratio of the corotation radius Rcr to the bar radius Rbar. Stellar dynamics sets an upper limit to Ωbar (Contopoulos 1980): the bar can extend only as far as the corotation radius Rcr (where Ωbar equals the circular frequency) and this implies ℛ ≥ 1. On the other hand, there is no lower limit for Ωbar since the bar can be much shorter than Rcr. The bar rotation rate ℛ distinguishes between “fast” and “slow” bars when 1 ≤ ℛ ≤ 1.4 and ℛ > 1.4, respectively. The limiting value 1.4 was set by numerical simulations (Athanassoula 1992; Debattista & Sellwood 2000) and it does not imply any specific range for Ωbar. The case of ℛ < 1 corresponds to an unstable regime for stellar orbits. Nevertheless, some example of these “ultrafast” bars have been suggested (Buta & Zhang 2009; Aguerri et al. 2015; Guo et al. 2019). Theoretical studies (Weinberg 1985) and simulations (e.g. Little & Carlberg 1991; Hernquist & Weinberg 1992; Debattista & Sellwood 1998, 2000) find an efficient and rapid slowdown of the rotation of the bar due to the dynamical friction exerted by the halo. This corresponds to an evolution of ℛ from the fast to the slow regime.
A sustained effort has been devoted to determining Ωbar and ℛ in a large number of galaxies to understand how they are related to other properties of the bar and other galaxy components. Rautiainen et al. (2008) derived Rcr for 38 barred galaxies. They compared the observed morphology with that predicted by a set of dynamically motivated numerical simulations with different Ωbar and dark matter halo contributions. They found some weak correlations between ℛ and galaxy morphology, with ETBGs hosting fast bars and LTBGs showing both fast or slow bars. In this method slow bars tend to be shorter and weaker when Sbar is given by the gravitational torque of the bar, with no clear trend with either galaxy luminosity or colour. Rautiainen et al. (2008) pointed out that their findings depend strongly on the adopted modelling, and leave room for the possibility that the derived pattern speed in many galaxies is that of the spiral structure rather than the bar’s. They also claimed that the error estimates of model-based pattern speeds are typically small compared to other methods, even though it is controversial to compare the error estimates obtained with different methodologies (see Cuomo et al. 2019a, for a discussion). Font et al. (2017) derived Rcr in 68 spirals using the phase-reversals of gas streaming motions (see also Beckman et al. 2018, for a validation of this method). Most of these bars are fast: ℛ increases from T = 1 to T = 3 galaxies, then remains constant to T = 7 galaxies and drops for T = 9 galaxies. More massive galaxies (M* > 3.2 × 10¹⁰ M⊙) host both strong and weak bars, when Sbar is given by the bar Fourier density amplitudes, and the longest bars rotate at lower Ωbar. Intermediate-mass galaxies (3.2 × 10⁹ < M* ≤ 3.2 × 10¹⁰ M⊙) host the shortest bars, covering both the slow and fast regimes. Less massive galaxies (M* < 3.2 × 10⁹ M⊙) host only weak bars, which always rotate slowly and can be very short. Font et al. (2017) suggested that evolved barred galaxies are characterised by high stellar masses and slowly rotating long bars. This is consistent with the two main scenarios for bar formation, namely internal processes or tidal interactions. Moreover, the authors reported that bars in the fast regime can rotate at very low Ωbar, suggesting that these bars can increase their length more quickly than Rcr while they are braked.
However, the pattern speed estimates obtained by Rautiainen et al. (2008) and Font et al. (2017) are not directly measured, contrary to the method proposed by Tremaine & Weinberg (1984a, hereafter TW).
The early applications of the TW method to long-slit spectroscopic data of a small number of galaxies did not lead to any firm conclusions about the relations between Ωbar (and ℛ) and global galaxy properties. Recently, the TW method has been applied to integral-field spectroscopic data of a large number of galaxies. Aguerri et al. (2015) investigated 15 strongly barred galaxies in the CALIFA survey (Sánchez et al. 2012; Walcher et al. 2014). They combined their results with previous measurements based on the TW method (see Corsini 2011, for a review), collecting a sample of 32 galaxies. For all these galaxies they found that 1.0 ≤ ℛ ≤ 1.4, independent of Hubble type. Aguerri et al. (2015) concluded that both ETBGs and LTBGs are consistent with hosting fast bars, but they were limited by their small sample. Guo et al. (2019) performed a similar analysis on a sample of 51 galaxies from the MaNGA survey (Bundy et al. 2015). They found that larger bars are stronger, when Sbar is measured by the bar Fourier density amplitudes, but they were unable to find any trend between ℛ and stellar age, metallicity, bar strength, or dark matter fraction within an effective radius. Guo et al. (2019) argued this is due to the various factors involved in the slowdown process and angular momentum exchange. However, it should be noted that the large uncertainties on their measurements could have heavily affected their conclusions. Finally, Cuomo et al. (2019b) analysed 16 weakly barred CALIFA galaxies and found that weak bars, quantitatively defined using the bar Fourier density amplitudes, have shorter Rbar and Rcr, but Ωbar and ℛ similar to those of strong bars. The fact that weak bars are fast excludes that they formed by tidal interactions (Martinez-Valpuesta et al. 2017; Łokas 2018). Garma-Oehmichen et al. (2020) analysed a sample of 18 galaxies from both CALIFA and MaNGA data, 13 of which were taken from Aguerri et al. (2015) and Guo et al. (2019) to test the applicability of the TW method. The authors found that longer bars present larger corotation radii and tend to rotate at lower pattern speeds. No correlation was found between ℛ and the total stellar mass nor the Hubble type, as in previous works, but a weak correlation between ℛ and molecular gas mass was noted. Moreover, they observed an increase in ℛ and a decrease in Ωbar with an increase in the molecular gas fraction, which they interpreted as evidence of a more efficient slowdown of the bar in gaseous discs. Finally, Ωbar appeared to decrease with the stellar mass, suggesting that the most massive galaxies host bigger and slower bars. However, these relations have to be considered with caution given the small number of analysed galaxies and large errors on the measured quantities.
In this paper we revisit the full sample of galaxies with a TW measured Ωbar. We collect, for the first time, all the measurements based on the TW method available in literature, doubling the number of analysed galaxies with respect to similar previous works (Aguerri et al. 2015; Cuomo et al. 2019b; Guo et al. 2019). The galaxies span a wide range of Rbar, Sbar, and Ωbar with direct measurements, allowing us to infer possible relations between the properties of bars and their host galaxies. The paper is structured as follows. We present the galaxy sample in Sect. 2. We collect the bar properties of the sample galaxies in Sect. 3, and tabulate them in Appendix A. We present and discuss our results in Sects. 4 and 5, respectively. We summarise our conclusions in Sect. 6. We adopt as cosmological parameters Ωm = 0.286, ΩΛ = 0.714, and H0 = 69.3 km s−1 Mpc−1 (Hinshaw et al. 2013).
2. The sample
We collected a sample of 104 galaxies with a direct measurement of Ωbar based on stellar kinematics available in the literature. Either long-slit or integral-field spectroscopy was used to obtain the mean position and mean line-of-sight (LOS) velocity of the stars across the bar needed to apply the TW method. All the sample galaxies were analysed in a consistent way and are divided into three subsamples according to their source:
1. The literature subsample (see Table A.1) includes 18 galaxies taken from papers with small samples (Merrifield & Kuijken 1995; Gerssen et al. 1999, 2003; Debattista et al. 2002; Aguerri et al. 2003; Corsini et al. 2003, 2007; Debattista & Williams 2004; Treuthardt et al. 2007; Cuomo et al. 2019a), applying the TW method to a single object or a small number observed with different telescopes and instruments (see Corsini 2011, for an almost complete review). Although the Hubble types of this subsample run from SB0 to SBbc, the majority of the galaxies (∼85%) are classified as SB0 or SBa. This reflects a selection bias of the early applications of the TW method, when ETBGs were preferred because it was more straightforward to apply the TW method, since they better fulfil the constraints of the method discussed in Sect. 3.3. The redshifts are z < 0.025, with ∼70% of the subsample galaxies having z < 0.01. The absolute SDSS r-band magnitudes are distributed between −18.0 and −22.0 mag.
2. The CALIFA subsample (see Table A.2) includes 31 galaxies taken from the CALIFA survey and has 15 strongly barred galaxies and 16 weakly barred galaxies analysed by Aguerri et al. (2015) and Cuomo et al. (2019b), respectively. The CALIFA survey targeted ∼600 galaxies selected from the SDSS-DR7 (Abazajian et al. 2009) according to their angular isophotal diameter (D25 ∼ 45 − 80 arcsec) and redshift (z ∼ 0.005 − 0.03). The galaxies of the CALIFA subsample have Hubble types ranging from SB0 to SBd, redshifts 0.005 < z < 0.03, with most of them (∼85%) in the range 0.01 < z < 0.02, and absolute SDSS r-band magnitudes spanning between −19.5 and −22.5 mag.
3. The MaNGA subsample (see Table A.3) includes 55 galaxies taken from the MaNGA survey: 51 of them were measured by Guo et al. (2019), while the remaining 4 by Garma-Oehmichen et al. (2020)1. The MaNGA survey (Drory et al. 2015; Yan et al. 2016; Wake et al. 2017) aims to investigate ∼10 000 nearby galaxies from the SDSS Main Galaxy Legacy Area (Abazajian et al. 2009). The galaxies were selected to have redshifts 0.02 < z < 0.1 and colour-based stellar masses M* > 109 M⊙. The original 53 galaxies of Guo et al. (2019) turned out to be 51 because two pairs of objects are repeated. The galaxies in this subsample have Hubble types ranging from SB0 to SBc, although most of them (∼70%) are late-type galaxies. Their redshift range reflects the mother sample distribution (0.02 < z < 0.08) and the galaxies of the most populated bin (∼55%) have 0.025 < z < 0.04. The absolute SDSS r-band magnitudes are distributed between −19.5 mag and −23.0 mag.
For each galaxy in our sample, we adopted the morphological classification and redshift of its corresponding paper. If the galaxy redshift was not immediately available, we took the value given by NED2. We calculated the absolute SDSS r-band magnitude Mr either from the model r-band apparent magnitude mr provided by the SDSS DR14, or using the apparent magnitude in a different band converted into mr using the prescriptions of Fukugita et al. (1996). To this end, we considered the galaxy distance from NED as obtained from the radial velocity with respect to the cosmic microwave background reference frame.
Figure 1 shows the distributions of the Hubble types, redshifts, and absolute SDSS r-band magnitudes of the three subsamples together with the total distribution of the entire sample. The literature subsample is comprised mostly of ETBGs, whereas the CALIFA and MaNGA subsamples contain a more representative number of LTBGs. The redshifts are smaller for the literature and CALIFA subsamples than for MaNGA. More than 90% of the sample galaxies are brighter than Mr = −20.0 mag. Although the three subsamples show similar distributions of Mr, it is clear that the brightest galaxies mainly come from the MaNGA subsample and the fainter ones from the literature subsample.
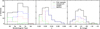 |
Fig. 1. Distributions of Hubble types, redshifts z, and SDSS r-band absolute magnitudes Mr of the full sample of 104 galaxies (black solid line), literature subsample (green dot-dashed line), CALIFA subsample (red dotted line), and MaNGA subsample (blue dashed line). |
Starting from the original sample of 104 galaxies, we selected for our analysis a subsample of 77 objects with a trustworthy measurement of Ωbar and ℛ, as described in Sects. 3.5 and 4.
3. Determination of the bar parameters
3.1. Bar radius
The value of Rbar is a measure of the extension of the stellar orbits supporting the bar. It is quite difficult to derive because a bar does not have sharp edges and often fades smoothly into other components (like rings or spiral arms) which may affect the identification of its boundary. Several methods have been used to measure Rbar. We briefly review the measurement techniques adopted for the sample galaxies.
A first approach to measure Rbar is based on the direct analysis of galaxy images. A rough estimate is obtained by visually inspecting the images (e.g. Merrifield & Kuijken 1995; Treuthardt et al. 2007) or by identifying the change in slope of the surface brightness profile along the bar major axis (e.g. Gerssen et al. 1999). Two more refined techniques require the study of the radial profile of ellipticity, ϵ, and position angle, PA, of the ellipses which best fit the galaxy isophotes. The galaxy isophotes show a peak of ϵ and a constant PA in the bar region, and a (generally different) constant PA in the disc region, or a non-constant behaviour (e.g. when prominent spirals arms are present). The value of Rbar is identified as the position of the maximum in the ϵ profile (e.g. Aguerri et al. 2015; Cuomo et al. 2019b; Garma-Oehmichen et al. 2020; Guo et al. 2019) or as the position where the PA changes by ΔPA = 5° from the PA of the ellipse corresponding to the maximum in ϵ (e.g. Aguerri et al. 2015; Cuomo et al. 2019b; Garma-Oehmichen et al. 2020; Guo et al. 2019). A different approach is based on the Fourier analysis of the images, which consists in the decomposition of the deprojected azimuthal luminosity profile of the galaxy into a Fourier series (Aguerri et al. 2000). Through this analysis, Rbar can be recovered from the luminosity contrasts between the bar and interbar intensity as a function of radial distance (e.g. Debattista et al. 2002; Aguerri et al. 2003, 2015; Gerssen et al. 2003; Debattista & Williams 2004; Corsini et al. 2007; Cuomo et al. 2019b,a; Guo et al. 2019) or from the phase angle of the Fourier mode m = 2 (e.g. Aguerri et al. 2003; Gerssen et al. 2003; Corsini et al. 2003, 2007; Debattista & Williams 2004). Analysing the PA of the deprojected isophotal ellipses, Rbar is the position where the PA changes by a value of 10° from the PA of the ellipse with the maximum ϵ value (e.g. Debattista et al. 2002; Aguerri et al. 2003; Corsini et al. 2003, 2007; Cuomo et al. 2019a). Finally, it is possible to perform a photometric decomposition of the surface brightness distribution of the galaxy (e.g. Aguerri et al. 2003; Corsini et al. 2003, 2007; Gerssen et al. 2003; Cuomo et al. 2019a); however, this depends on the adopted parametric laws for the different galaxy components. The choice of a single measurement method is usually limited by its own weaknesses, so usually more than one method is adopted to recover Rbar, which is then given by the combined results from the different applied methodologies (e.g. Aguerri et al. 2003, 2015; Guo et al. 2019; Cuomo et al. 2019b,a). We collected the value of Rbar provided by previous works for each galaxy in the sample, which corresponds to the mean value obtained with the different methods adopted in the corresponding work. The values of Rbar for all the sample galaxies are listed in Tables A.1–A.3.
3.2. Bar strength
The value of Sbar describes the contribution of the bar to the galaxy potential and measures the non-axisymmetric forces produced by the bar. A variety of methods have been developed to measure Sbar, and here we briefly review those adopted for the sample galaxies. The first method is based on the intrinsic ellipticity of the bar, which can be obtained from the isophotal radial profile or from a photometric decomposition (e.g. Cuomo et al. 2019a). A related approach consists in measuring the total non-axisymmetry strength parameter Qt (e.g. Treuthardt et al. 2007). Finally, Sbar can be recovered in various ways from a Fourier analysis, either from the peak of the ratio of the amplitudes of the m = 2 to m = 0 Fourier components (e.g. Guo et al. 2019; Cuomo et al. 2019a) or from the integral of the ratio between the m = 2 and m = 0 Fourier components divided by Rbar (e.g. Cuomo et al. 2019b). Since these different methods are connected to different bar properties, their results can considerably differ, even for the same object.
In the sample of galaxies studied here, the strengths of the bars were not always measured in previous works; this is especially true for the literature subsample and for the galaxies in Aguerri et al. (2015) and Garma-Oehmichen et al. (2020). To have consistent measurements of Sbar, we thus adopted the peak of the ratio between the amplitudes of the m = 2 and m = 0 Fourier components when this was available from the literature (Kim et al. 2016b; Cuomo et al. 2019b,a; Guo et al. 2019), and derived Sbar for all the galaxies for which it was not already available and for which we have photometric data to perform the Fourier analysis. We obtained the uncertainties on Sbar by performing a Fourier analysis using the two halves of the deprojected azimuthal surface brightness, as in Cuomo et al. (2019b). Galaxies with missing values correspond to results taken from the literature where uncertainties were not provided and we were not able to repeat the analysis. Three galaxies in the literature subsample are lacking an estimate of Sbar since photometric data to perform the Fourier analysis are not available. The values of Sbar for all the sample galaxies are listed in Tables A.1–A.3.
3.3. Bar pattern speed
There are several methods for recovering Ωbar (see Corsini 2011 for a discussion), but the only model-independent method is that based on the TW equation,
 (1)
(1)
where i is the disc inclination, and
 (2)
(2)
are the photometric, ⟨X⟩, and kinematic, ⟨V⟩, integrals, defined as the luminosity-weighted average of position X and LOS velocity Vlos, respectively, where Σ is the surface brightness, measured along directions parallel to the disc major axis and applied to a tracer population satisfying the continuity equation. In practice, the integrals are calculated along several apertures, one centred on the galaxy centre and the others with an offset, but all aligned with the disc major axis. The slope of the straight line defined by the measured values of ⟨X⟩ versus ⟨V⟩ gives Ωbar sin i. When using integral-field spectroscopic data, the luminosity weights in the integrals are obtained by collapsing the datacube along the wavelength and the spatial directions of each pseudo-slit (Cuomo et al. 2019a). As an alternative, the kinematic integrals can be directly obtained from the stellar velocity field using either a map of the surface brightness (Aguerri et al. 2015; Garma-Oehmichen et al. 2020; Guo et al. 2019) or stellar mass (Aguerri et al. 2015) as a weight in the definition of the integral. However, the mass and light distributions often do not match well, particularly in the presence of ongoing star formation, as is usually the case in late-type galaxies. Gerssen & Debattista (2007) explored with numerical simulations the effect of dust and star formation on the TW method, concluding that it is negligible and that its application can be extended to the full range of Hubble types. Moreover, Aguerri et al. (2015) showed that surface brightness and stellar mass used as weights for the integrals lead to consistent results.
Despite the simple formulation, the TW method has some critical issues as well. It assumes that a barred galaxy has a single well-defined pattern speed. However, it can host components that are independently rotating, such as an inner bar and spiral arms (e.g. Tagger et al. 1987; Sellwood & Sparke 1988; Sygnet et al. 1988). Corsini et al. (2003) attempted the application of the method to the double-barred galaxy NGC 2950. They successfully derived the pattern speed of the primary bar and argued that the secondary bar is independently rotating. Meanwhile, spiral arms perturb not just the TW measurements, but also the measurements of bar length (Petersen et al. 2019; Hilmi et al. 2020). To deal with such issues, methods taking into account the radial change of the pattern speed have been developed (e.g. Meidt et al. 2008a,b). The number of pseudo-slits used to measure the TW integrals is a critical element in the error budget of Ωbar (Corsini 2011). Since Ωbar is related to the slope of a linear fit between the integrals, it is necessary to define at least three pseudo-slits to get the slope (in principle two, but in practice not enough since both the integrals are affected by their own errors). Usually, the number of pseudo-slits is maximised according to the characteristics of the specific target and/or to the observations, and the effect is taken into account in the uncertainty associated with Ωbar, as explored by Cuomo et al. (2019a, 2020).
The most critical parameter for the TW method is the correct definition of the PA of the disc along which to locate the pseudo-slits (Debattista 2003; Cuomo et al. 2019a; Garma-Oehmichen et al. 2020; Zou et al. 2019). Isophotal analysis, photometric decomposition, and kinemetry have been shown to give consistent results (Aguerri et al. 2015; Guo et al. 2019; Cuomo et al. 2019b).
To have consistent values of Ωbar for all the sample galaxies, for our analysis we selected the TW measurements with the photometric PA of the galaxy major axis when more than one PA estimate was available (e.g. Cuomo et al. 2019b; Garma-Oehmichen et al. 2020; Guo et al. 2019), and the luminosity weight in the integrals. We collected the values of Ωbar provided by previous works for each galaxy in the sample. The values of Ωbar for all the sample galaxies are listed in Tables A.1–A.3.
3.4. Corotation radius and bar rotation rate
The value of Rcr is the radius where the gravitational and centrifugal forces cancel out in the rest frame of the bar; it is given by the ratio of Vcirc to Ωbar. A simple and basic approach to compute Vcirc consists in using the maximum of the (cold) gaseous rotational velocity as an approximation for Vcirc (e.g. Treuthardt et al. 2007). Another straightforward and more solid estimate consists in the application of the asymmetric drift correction to the observed stellar streaming velocities (e.g. Merrifield & Kuijken 1995; Debattista et al. 2002; Aguerri et al. 2003, 2015; Corsini et al. 2003, 2007; Gerssen et al. 2003; Debattista & Williams 2004; Cuomo et al. 2019b,a). A full dynamical model built from the kinematics and surface brightness of the stellar component represents a more sophisticated approach to recover Vcirc (e.g. Gerssen et al. 1999; Guo et al. 2019). Moreover, the value of Rcr can be directly estimated as the intersection between Ωbar and the modelled angular rotation curve (e.g. Garma-Oehmichen et al. 2020). This approach is useful for galaxies where the rotation curve rises slowly and Rcr can be overestimated when measured using Vcirc.
The bar rotation rate ℛ is given by the ratio between Rcr and Rbar, and it is provided for all the galaxies in our sample. We collected the values of Rcr and ℛ provided by previous works for each galaxy in the sample. The values of Rcr and the resulting ℛ for all the sample galaxies are listed in Tables A.1–A.3.
3.5. Uncertainties on bar parameters
The successful application of the TW method requires the disc to have an intermediate i and the bar to be located at an intermediate PA with respect to the disc major and minor axes. When the galaxy is too inclined, it is difficult to identify the bar and consequently to place the apertures. On the other hand, a low value of i corresponds to low LOS velocities with large errors. Instead, if the bar is almost aligned to the disc major axis it is difficult to define a sufficient number of apertures. The other extreme case, when the bar is close to the disc minor axis, leads to low values of the photometric integrals. These extreme situations make it hard to apply the TW method and to control the errors, which translates into large uncertainties in the measured parameters (Debattista 2003; Corsini 2011; Zou et al. 2019). For these reasons, all the sample galaxies have an inclination 20 ° ≲i ≲ 70° and a PA difference between bar and disc axes 10 ° ≲ΔPA ≲ 80°.
The disc inclination and the position of the bar with respect to the disc axes may also affect the correct estimation of Rbar (Debattista 2003; Corsini 2011). Moreover, recovering bar orientation and ellipticity from ellipse fits can be very difficult in real galaxies, especially when the galaxy is very inclined, as explored by Comerón et al. (2014). Using toy models, the authors showed that the orientation of the bar with respect to the line of nodes can be correctly recovered for intermediate inclination i < 60° when the bar is long and for i < 40° when the bar is small with respect to the bulge. For highly inclined galaxies, it is not always possible to obtain reliable bar properties.
Figures 2 and 3 show the relative errors on Ωbar, Rbar, and Rcr for the sample galaxies as a function of the disc i and bar ΔPA, respectively. Despite the large uncertainties of some values, we did not observe any significant trend and we excluded any selection bias on the galaxy sample. There is also no evident bias for the ultrafast bars. Twelve galaxies (∼12%) in the sample host a bar with ℛ < 1.0 at 95% confidence level. All of them are found in LTBGs. Currently, we do not yet know whether ultrafast bars are an artefact of the TW method or a new class of objects that disprove the predictions of theory and numerical simulations about the size of the bar (see also Aguerri et al. 2015; Guo et al. 2019, for a discussion). This requires further investigation, which is beyond the scope of this paper, and we therefore ignore the 12 ultrafast bars in the rest of our analysis.
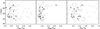 |
Fig. 2. Relative errors on the bar pattern speed ΔΩbar/Ωbar, bar radius ΔRbar/Rbar, and corotation radius ΔRcr/Rcr as a function of the disc inclination i. Ultrafast bars are highlighted (black filled points). Galaxies with relative errors larger than 100% are not shown. |
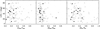 |
Fig. 3. As in Fig. 2, but as a function of the bar orientation with respect to the disc major and minor axes ΔPA, given as the absolute value of the difference between the PA of the bar and that of the axes on the sky plane. |
4. Results
4.1. Results for the galaxy sample
The mean relative errors and the corresponding standard deviations (in parentheses) on the bar parameters for the sample galaxies listed in Tables A.1–A.3 are ⟨ΔΩbar/Ωbar⟩ = 0.35 (0.57), ⟨ΔRbar/Rbar⟩ = 0.20 (0.11), and ⟨ΔSbar/Sbar⟩ = 0.1 (0.1), leading to ⟨ΔRcr/Rcr⟩ = 0.47 (0.56), and ⟨Δℛ/ℛ⟩ = 0.5 (0.4). In a number of galaxies the uncertainties on Ωbar, Rcr, and ℛ are larger than 100%; this happens in 2% of the sample galaxies for Ωbar, 9% for Rcr, and 13% for ℛ. For a subsample of 53 galaxies we considered the bulge-to-total luminosity ratio B/T from the photometric decompositions available in the literature (Treuthardt et al. 2007; Laurikainen et al. 2010; Salo et al. 2015; Méndez-Abreu et al. 2017; Kruk et al. 2018; Cuomo et al. 2019a, Tables A.1 and A.2). In order to maximise and harmonise the number of galaxies with available B/T values, we preferred bi-dimensional parametric decompositions, which include the possibility to model a bar and are based on SDSS r-band images or on other bands equivalently suitable for measuring the bulge contribution. Salo et al. (2015) used Spitzer 3.6 μm band images, while Laurikainen et al. (2010) used Ks-band images. However, the adopted photometric decompositions do not usually include structural subcomponents such as nuclear and/or inner lenses or barlenses. This was done in order to reduce the fit degeneracy (Méndez-Abreu et al. 2017), but this may affect the correct estimate of the bulge contribution (see e.g. Athanassoula et al. 2005; Herrera-Endoqui et al. 2015; Laurikainen & Salo 2017, for a discussion).
After excluding the galaxies hosting an ultrafast bar, we only considered a subsample with bar pattern speeds of ΔΩbar/Ωbar ≤ 0.5 as trustworthy. The final sample consists of 77 objects with 34 ETBGs (with Hubble stage ranging between T = −4 to 1, i.e. SB0-SBa) and 43 LTBGs (with T between 2 and 7, i.e. SBab-SBc). They have mean relative errors and corresponding standard deviation (in parentheses) of ⟨ΔΩbar/Ωbar⟩ = 0.26 (0.12), ⟨ΔRbar/Rbar⟩ = 0.20 (0.11), and ⟨ΔSbar/Sbar⟩ = 0.09 (0.07) leading to ⟨ΔRcr/Rcr⟩ = 0.40 (0.55) and ⟨Δℛ/ℛ⟩ = 0.4 (0.4). The subsample of galaxies with available B/T ratio reduces to 42 objects. The mean values and the corresponding standard deviations of the bar parameters for the final selected sample, ETBGs, and LTBGs, are listed in Table 1.
Mean value and corresponding standard deviation in parenthesis of the bar parameters for the final sample of 77 objects, for the 34 ETBGs, and for the 43 LTBGs.
We investigated all the possible relations between the available parameters of the bars (Rbar, Sbar, Ωbar, Rcr, and ℛ) and their host galaxies (Hubble type, Mr, and B/T) using the IDL task R_CORRELATE (Press et al. 1992), which computes the Spearman rank correlation r of two populations and the corresponding two-sided significance p of its deviation from the null hypothesis. The p value measures how likely any observed correlation is only due to chance. Values close to 0 suggest that the correlation is strong and that the null hypothesis of no significant correlation is not correct. In this case, a high value of p is expected even when the effect of the correlation on r is less stringent. We estimated the number of standard deviations σ by which the sum-squared difference of the ranks deviates from its null hypothesis (Press et al. 1992). The resulting correlation parameters are given in Table B.1. We find the following:
-
very strong correlations (|r|≥0.7 and p < 0.01, resulting in a 99% confidence level that the correlation is not given by chance) between Ωbar and Rcr (bars with larger corotation radii rotate at lower pattern speeds), between Rbar and Rcr (longer bars have larger corotation radii), and between Mr and Rbar (fainter galaxies host shorter bars);
-
strong correlations (0.4 ≤ |r| < 0.7 and/or 0.01 ≤ p < 0.05, confidence level between 99% and 95%) between Ωbar and Rbar (longer bars rotate at lower pattern speeds), between ℛ and Ωbar or Rcr (fast bars rotate at higher pattern speeds and have smaller corotation radii), between Mr and Ωbar or Rcr (fainter galaxies host bars that rotate at higher pattern speeds and have smaller corotation radii), and between Rbar and Sbar (shorter bars are weaker);
-
weak correlations (0.2 ≤ |r| < 0.4 and/or 0.05 ≤ p < 0.1, confidence level between 90% and 95%) between Ωbar and Hubble type (bars in ETBGs rotate at higher pattern speeds), between Ωbar and Sbar (stronger bars rotate at lower pattern speeds), and between Rcr and Sbar (weaker bars have smaller corotation radii);
-
no correlation (|r| < 0.2 and p ≥ 0.1) between Hubble type and Mr, Rbar, Sbar, Rcr, or ℛ; between ℛ and Rbar, Sbar, or Mr; between Mr and Sbar; and between B/T and Ωbar, Rbar, Sbar, Rcr, or ℛ.
We checked and confirmed that the correlations remain mostly unchanged after splitting the final sample into ETBGs and LTBGs (Table B.1). For ETBGs, the correlations Ωbar–Sbar and Sbar–Rcr become strong. In addition, a weak correlation ℛ–Sbar appears and we found a strong Mr–Sbar correlation (brighter galaxies host stronger bars). For LTBGs, the correlation Rcr–Sbar becomes weak, a weak anti-correlation ℛ–Sbar appears with respect to ETBGs, while the correlation Sbar–Mr disappears.
Figures 4 and C.1 show the correlations found between Ωbar and Hubble type, Mr, Rbar, or Sbar before and after splitting the final sample between ETBGs and LTBGs, respectively. The points are colour-coded according to the value of ℛ, highlighting the correlation between ℛ and Ωbar. Figures 5 and C.2 show the correlations found between Rbar and Mr, Sbar, or Rcr before and after splitting the final sample between ETBGs and LTBGs, respectively. The points are colour-coded according to the nominal value of ℛ, highlighting the correlation between ℛ and Rcr. Figure 6 shows the correlation between B/T and Sbar for the subsample of 41 galaxies with an available photometric decomposition and an estimate of Sbar. The points are colour-coded according to ℛ, highlighting the correlation ℛ–Rcr and pointing that there is no correlation between ℛ and Mr, Rbar, or Sbar.
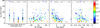 |
Fig. 4. Relations between the bar pattern speed Ωbar and the Hubble type, SDSS r-band absolute magnitude Mr, bar radius Rbar, and bar strength Sbar for the selected sample of 77 galaxies. The Spearman rank correlation r, two-sided significance p, and number of σ from the null hypothesis are given in each panel. The points are colour-coded according to the value of ℛ. Results obtained using different bands with respect to the SDSS r-band are represented with a square symbol. The mean value of Ωbar for each bin of Hubble type is shown (black filled stars). The results for the Milky Way are shown both for the short bar case (black open diamond) and long bar case (black open square). |
4.2. Results for the Milky Way
The Milky Way is a barred galaxy. A great deal of effort has been made to derive the bar parameters of our own Galaxy and to understand whether it hosts a long or a short bar (see Bland-Hawthorn & Gerhard 2016, for a discussion). The long bar case (Portail et al. 2017; D’Onghia & Aguerri 2020) implies that the Milky Way bar rotates at lower Ωbar with respect to the short bar case (Dehnen 2000; Fragkoudi et al. 2019). These two alternative hypotheses give different results for Rcr, but similar values of ℛ. We collected the available results for the long bar case from Bland-Hawthorn & Gerhard (2016) and for the short bar case from Dehnen (2000). Our own galaxy has values of Rbar, Rcr, and Ωbar typical for a LTBG in both cases, but it lies slightly lower with respect to the relation Rbar–Mr for the short bar case (Figs. 4 and 5).
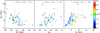 |
Fig. 5. Relations between the bar radius Rbar and the SDSS r-band absolute magnitude Mr, bar strength Sbar, and corotation radius Rcr for the selected sample of 77 galaxies. The Spearman rank correlation r, two-sided significance p, and number of σ from the null hypothesis are given in each panel for the selected sample of 77 galaxies. The points are colour-coded according to the value of ℛ. Results obtained using different bands with respect to the SDSS r-band are represented with a square symbol. The results for the Milky Way are shown both for the short bar case (black open diamond) and long bar case (black open square). |
4.3. Relations and sample selection
The relations discussed in Sect. 4.1 are almost unaffected by the selection criteria used to define the final sample (i.e. no ultrafast bars and relative error on Ωbar smaller than 50%). We calculated the Spearman correlation for each relation using the original sample of 104 galaxies, and we checked in particular the results observed between Ωbar and Hubble type, Mr, Rbar, and Sbar and between Rbar and Mr, Sbar, and Rcr. We verified that they do not change significantly from the results discussed in Sect. 4.1. The observed relations remain, including with Ωbar (becoming even stronger for Ωbar–Sbar), except for the case of Ωbar and Hubble type. In fact, Ωbar becomes constant along the Hubble sequence with no clear decrease in the intermediate types. This could be explained by the fact that ultrafast bars, associated with ℛ < 1.0 and partially implying a high value of Ωbar, are all found in galaxies later than SBb. In this case the correlation disappears. On the other hand, the observed relations involving Rbar remain.
5. Discussion
5.1. Relations among the bar parameters
Some of the relations we reported among the bar parameters of TW measured galaxies confirm earlier observational findings and/or theoretical predictions (Ωbar–Rbar, Ωbar–Sbar, Ωbar–Mr, Rbar–Sbar, Sbar–Rcr, Rbar–Mr, ℛ–Ωbar, and Ωbar–Rcr; Figs. 4 and 5). Others (Rbar–Rcr; Fig. 5) are related to the fact that the TW method finds mainly fast bars. Some bar parameters are not correlated at all (ℛ–Rbar and ℛ–Sbar; Figs. 4 and 5) because of the large scatter in their distribution. For example, the weak ℛ–Sbar relation found for ETBGs is found to be an anti-correlation for LTBGs, giving no correlation in the final sample. Moreover, we did not find any or very weak relations between Hubble type and bar properties (Hubble type-Rbar, Hubble type-Sbar, Hubble type-Rcr, and Hubble type-ℛ), even if some were previously suggested. The only exception is the weak Hubble type-Ωbar correlation; however, it disappears when considering the original sample of 104 galaxies (Fig. 4). Moreover, a large fraction of the galaxies in our sample come from Guo et al. (2019), who reported some of the relations discussed here.
It has already been shown that longer bars are stronger (Erwin 2005; Kruk et al. 2018; Guo et al. 2019; Cuomo et al. 2019b) (with a tighter correlation among ETBGs, as reported by Díaz-García et al. 2016b), but we found that they also rotate at a lower Ωbar (Fig. 4, right panel). This Ωbar–Sbar relation was theoretically predicted (Sellwood 1981; Debattista & Sellwood 2000; Athanassoula 2003; Villa-Vargas et al. 2010; Athanassoula et al. 2013). It can be explained in terms of bar evolution because of the exchange of angular momentum during bar evolution, which can vary according to different properties of the host galaxy, such as the initial disc hotness–coldness, as investigated by Athanassoula (2003). Our observational results are in agreement with the predictions of these numerical simulations. Although we are not able to probe the time evolution of a single bar, we conclude that the measured values of Ωbar and Sbar shown in the right panel of Fig. 4 represent snapshots of bars in galaxies with different properties. The relation Ωbar–Sbar was already explored in Cuomo et al. (2019b), where we did not find any difference between the distributions of Ωbar in strongly and weakly barred galaxies defined according to Sbar. This was probably due to the limited number of sample galaxies and/or because weak bars are expected to rotate at both high and low Ωbar, depending on other galaxy parameters. Font et al. (2017) discussed the correlation by plotting Ωbar scaled by the disc angular velocity versus Sbar and colour-coding the data according to the relative Rbar (their Fig. 9). Their largest bars appear to rotate more slowly, whereas the shortest bars have higher relative angular rates. They also observed that the strongest bars rotate at the lowest values of scaled Ωbar, while the bars that rotate at low scaled Ωbar can only have lower values of Sbar. However, they cautiously concluded that their results cannot probe any trends due to bar evolution.
Moreover, the bulge is expected to play an important role in the exchange of angular momentum within a barred galaxy. Simulations showed that a bulge can gain angular momentum from the bar, especially from the inner part of the bar, at the inner Lindblad resonance (Athanassoula 2003; Saha et al. 2016; Kataria & Das 2019). We explored the possible role of the bulge in the evolution of barred galaxies, but we did not find any correlations between B/T and Sbar, Rbar, or Ωbar, which could have confirmed that bulges act as efficient sinks of angular momentum from bars (Fig. 6). Other factors influence the efficiency of the angular momentum exchange. Athanassoula (2003) showed that dynamically hot absorbers hamper its transfer, in agreement with the analytical results by Lynden-Bell & Kalnajs (1972) and Tremaine & Weinberg (1984b). Combes & Elmegreen (1993) suggested that Ωbar critically depends on the relative bulge mass and h: galaxies with a high bulge-to-disc mass ratio tends to form rapidly rotating bars. These considerations suggest that many bulges in the analysed sample do not act as classical bulges. Moreover, there are three bulgeless galaxies (B/T = 0.0) in our sample, with a wide range of Sbar (Fig. 6). A weak B/T–Sbar correlation appears when they are discarded from the analysis (r = 0.3, p = 0.09, σ = 1.7). This result requires a further investigation on the behaviour of bulgeless barred galaxies.
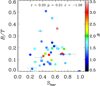 |
Fig. 6. Relation between the bulge-to-total luminosity ratio B/T and bar strength Sbar for the subsample of 41 galaxies with a photometric decomposition. The Spearman rank correlation r, the two-sided significance p, and number of σ from the null hypothesis are given. The points are colour-coded according to the value of ℛ. Results obtained using different bands with respect to the SDSS r-band are represented with a square symbol. |
The significant relations found between Ωbar and Rbar and other galaxies properties are highlighted in Figs. 4 and 5. The points are colour-coded according to the value of ℛ. This highlights the relations involving this third parameter. Figure 4 shows the Ωbar–ℛ relation in each panel, while the ℛ–Rcr relation is visible in the right panel of Fig. 5. More interestingly, no relation is found either between ℛ and Rbar even if they are bound by definition, or between ℛ and Sbar despite the strong Rbar–Sbar relation. We argue that the observed relations are driven by galaxy evolution: a bar evolves by shedding angular momentum to material at resonance, making the bar slow down; in the process the bar gets longer and stronger. As the bar slows down, Rcr is pushed outwards, where the density of the stars that can be trapped by the bar decreases. At some point the density becomes too low, so the bar size will not keep pace with Rcr. The relations Ωbar–Sbar, Sbar–Rbar, Ωbar–Rbar, and Rcr–Rbar closely fit the regime where the bar keeps pace with the slowdown. However, all the selected bars analysed so far are compatible with this fast regime at the 95% confidence level (even though some of them present nominal values of ℛ larger than 1.4, so we cannot exclude that these bars are fast taking into account the corresponding error on ℛ): this explains why no relations ℛ–Rbar and ℛ–Sbar are observed. In the context of galaxy evolution, this could be explained if the sample does not include either dynamically evolved barred galaxies or cases in which the exchange of angular momentum is very efficient. The observed lack of slow bars requires further investigation, from a theoretical and an observational point of view.
One could argue that the resulting relations are mostly driven by galaxy total mass rather than secular evolution. In particular, the Ωbar–Mr relation could be seen as a relation between the pattern speed and galaxy total mass through the well-known Vcirc–Mr relation (Tully & Fisher 1977). We explored the possible role of the galaxy total mass and claim it is not the main driver of the resulting relations. We did not observe a correlation between Ωbar and Vcirc in our sample of galaxies. Moreover, when discarding galaxies brighter than −21 mag from our final sample, the relations among the bar properties hold even if we do not observe a Ωbar–Mr relation. In this case the Spearman rank correlations and significances for the subsample of 33 galaxies become r = 0.1 and p = 0.4 for the Ωbar–Mr relation, whereas we obtained r = 0.4 and p = 0.03 for the Ωbar–Sbar relation, r = 0.6 and p = 8 × 10⁻⁵ for the Sbar–Rbar relation, r = −0.7 and p = 2 × 10⁻⁵ for the Ωbar–Rbar relation, and r = 0.6 and p = 7 × 10⁻⁵ for the Rcr–Rbar relation. However, it could be more significant to explore the effects of the Ωbar–Mr relation by defining several bins in magnitude. Unfortunately, this is not feasible here due to the small sample size. Upcoming observations for large samples of galaxies will help to further explore this issue (e.g. Balcells et al. 2010; Croom et al. 2012; Bundy et al. 2015).
5.2. Relations with the galaxy luminosity
We observed interesting relations between the bar parameters and galaxy luminosity. In particular, brighter galaxies host longer bars, which rotate at lower Ωbar and have larger corotation radii (Figs. 4 and 5). We verified that these strong correlations were not driven by fainter or brighter galaxies and/or by galaxies with bars rotating with very high Ωbar. The relations hold even when we split the final sample between ETBGs and LTBGs (Figs. C.1 and C.2).
Sheth et al. (2008) studied the bar fraction over 0.2 < z < 0.84 with a sample of more than 2000 luminous face-on spirals from the COSMOS survey (Scoville et al. 2007). The presence of a bar strongly correlates with both the stellar mass and bulge prominence. The bar fraction in very massive and luminous spirals (M* > 1010.9 M⊙, MV < −23.5 mag) is roughly constant out to z ∼ 0.84, whereas for the low-mass blue spirals (M* < 1010.5 M⊙, MV > −22.5 mag) it significantly declines beyond z = 0.3. On the other hand, the bar fraction at low redshift is roughly equal at all luminosities. The bar fraction at high redshift turned out to be slightly higher for bulge-dominated galaxies, suggesting a co-evolution of bars and bulges. At low redshift, this trend disappears and the bar fraction is roughly constant for all Hubble types, although only a few bulgeless galaxies are observed. Sheth et al. (2008) concluded that their results are a clue to a downsizing process in the formation of bars: the more massive and luminous galaxies have a higher bar fraction at higher redshift, which is close to the present-day value, whereas the less massive and luminous systems formed the majority of their bars at z < 0.8. The early presence of bars in massive galaxies suggests that these systems became dynamically cool and sufficiently massive to host a bar at earlier times. On the contrary, the less massive systems have a low bar fraction because they are dynamically hot, are not rotationally supported, or have not accreted sufficient mass to form a bar at high redshift.
Our results support the following scenario. In brighter galaxies we found lower Ωbar values together with larger Rbar and Rcr values, which are a signature of bar evolution, in agreement with the idea that these bars may have formed earlier and had sufficient time to slow down, grow in length, and push corotation outwards.
The conclusions from Sheth et al. (2008) were subsequently partially questioned. In particular, Erwin (2018, 2019) argued that those conclusions may be affected by a detection problem. SDSS-based studies preferentially miss bars in lower mass, bluer, and gas-rich galaxies due to poor spatial resolution; instead, Erwin found that bars are as common in blue gas-rich galaxies as they are in red gas-poor galaxies using Spitzer data (Erwin 2018). The absence of any dependence of the presence of the bar and its size or the gas mass fraction has brought Erwin (2019) to question theoretical models in which bar formation is suppressed by the high gas fraction in the disc. Moreover, Garma-Oehmichen et al. (2020) measured the molecular gas fraction in their sample of 18 galaxies and found a significant correlation with ℛ and a weak anti-correlation with Ωbar. All the galaxies with a small gas fraction are consistent with the fast–ultrafast regime, leading the authors to conclude that this could be an indication that bars do slow down more efficiently in gaseous discs.
Moreover, the claim from Sheth et al. (2008) of a strong correlation between the presence of a bar and bulge prominence has been disputed by recent work, which highlighted a large fraction of barred galaxies in late-type galaxies (T ≥ 5; Buta et al. 2015; Díaz-García et al. 2019), many of which are known to be bulgeless (Salo et al. 2015) or to host very small bulges (Costantin et al. 2020). Our results support the idea that a possible co-evolution between bulge and bar is not confirmed by the absence of correlations between B/T and the main bar parameters. Only a weak B/T–Sbar correlation appears when excluding the bulgeless galaxies from our sample (Fig. 6).
5.3. Relations involving the normalised sizes of galaxies
We collected the Petrosian radius RPetro and corresponding error provided by the SDSS in the r-band for our original sample of galaxies when available. According to the selection criteria described in Sects. 3.4 and 4 and the availability of RPetro, we obtain a restricted sample of 67 galaxies. Then we normalised Rbar and Rcr by RPetro and we reanalysed all the correlations listed in Table B.1, measuring the Spearman correlation parameters. We observe a very strong correlation between Rbar and RPetro (larger bars correspond to larger Petrosian radii); a strong correlation between scaled Rbar and scaled Rcr (shorter bars according to the normalised size are associated with shorter normalised corotation radii), between Sbar and normalised Rbar and Rcr (weaker bars are shorter according to the normalised size and have shorter normalised corotation radii), between Ωbar and normalised Rcr (bars rotating with large pattern speeds present shorter normalised corotation radii), and between Rcr and RPetro (larger corotation radii correspond to larger Petrosian radii); a weak correlation between Hubble type and both normalised Rbar and Rcr (late-type galaxies have shorter normalised bars and shorter normalised corotation radii); no correlation between Mr and normalised Rbar or normalised Rcr, and between Ωbar and normalised Rbar (Fig. D.1). When considering the normalised sizes, the main difference with respect to previous discussed results is that the correlations Mr-normalised Rbar and Mr-normalised Rcr and Ωbar-normalised Rbar disappear. However, a weak Ωbar-normalised Rbar correlation appears (r = 0.2, p = 0.08, σ = 1.8) when discarding the point corresponding to the double-barred galaxy NGC 2950 with high Ωbar and large normalised Rbar. A strong Sbar–Rbar correlation after normalising bar lengths to the disc size was previously reported by Elmegreen et al. (2007) and Gadotti (2011).
6. Conclusions
We took into account all the barred galaxies available in the literature with a direct measurement of Ωbar obtained with the TW method from long-slit or integral-field spectroscopic data of stellar kinematics. We gathered the data from Corsini (2011), Cuomo et al. (2019b,a), Aguerri et al. (2015), Garma-Oehmichen et al. (2020), and Guo et al. (2019). The sample consists of 104 galaxies with Hubble types ranging from SB0 to SBd, redshifts z < 0.08, and SDSS r-band absolute magnitudes −23 < Mr < −18 mag. For each galaxy, we collected the values of the bar radius Rbar, bar strength Sbar, bar pattern speed Ωbar, corotation radius Rcr, and bar rotation rate ℛ. To have consistent measurements of Sbar, we derived it from the m = 2 normalised bar Fourier amplitude following Athanassoula & Misiriotis (2002) for galaxies for which it was not already available in literature. We also collected the B/T ratio for a subsample of galaxies with an available photometric decomposition.
The successful application of the TW method requires the disc to have an intermediate inclination i and the bar to be located at an intermediate PA with respect to the disc major and minor axes. We checked that these selection criteria do not systematically affect the uncertainties on Rbar, Ωbar, and Rcr. Moreover, there is no bias for the ultrafast bars (ℛ < 1.0) we found in 12 LTBGs of the sample (∼12%). At the moment, we do not yet know whether ultrafast bars are an artefact of the TW method or a new class of objects that violates the predictions of theory and numerical simulations about the extension of the bar, even if the fact that they are found only in late-type galaxies may strengthen the first hypothesis (but see also Aguerri et al. 2015; Guo et al. 2019, for a discussion). This issue requires further investigation, possibly based on dynamical modelling (e.g. Vasiliev & Valluri 2020), but this is beyond the scope of the paper. Therefore, we decided to consider only the 77 sample galaxies with a small relative error on Ωbar (ΔΩbar/Ωbar ≤ 0.5) and not hosting an ultrafast bar (ℛ < 1). We investigated all the possible relations between the available bar parameters (Rbar, Sbar, Ωbar, Rcr, and ℛ) and galaxy properties (Hubble type, Mr, and B/T) and discussed their significance. Some of the relations we reported confirm earlier observational findings and/or theoretical predictions (Ωbar–Rbar, Ωbar–Sbar, Ωbar–Mr, Rbar–Sbar, Sbar–Rcr, Rbar–Mr, ℛ–Ωbar, and Ωbar–Rcr). We verified that the stronger relations are not driven by fainter or brighter galaxies, galaxies with very fast bars, and Hubble type. Moreover, the correlation Ωbar–Mr is not driving the others. It is possible to define a luminosity cut subsample for which the correlation Ωbar–Mr does not hold, while all the others do, and no Ωbar–Vcirc correlation is found.
In particular, we found that stronger bars rotate more slowly. The Ωbar–Sbar relation was theoretically predicted, but never clearly observed. It can be explained in terms of bar evolution because of the exchange of angular momentum during bar evolution depending on galaxy properties, as numerically investigated by Athanassoula (2003). We also reported that brighter galaxies host longer bars, which rotate more slowly and have a larger corotation radii. This observational finding is in agreement with a scenario of downsizing in bar formation if more massive galaxies formed earlier and had sufficient time to slow down, grow in length, and push outward corotation (Sheth et al. 2008). The possible role of the bulge and its co-evolution with the bar remain unclear.
The predictions of a long and short bar in the Milky Way are both in agreement with the findings obtained from our sample. The values obtained for Ωbar, Rbar, Rcr, and Mr for both the models end up in the region of the explored relations spanned by our sample (i.e. the Ωbar–Rbar, Ωbar–Mr, Rbar–Rcr relations; Figs. 4 and 5). However, the short bar model is slightly below the explored Rbar–Mr relation, which favours the long bar.
The authors repeated the analysis for the galaxies in common with Aguerri et al. (2015) and Guo et al. (2019); for these objects we considered the former results.
The NASA/IPAC Extragalactic Database is available at https://ned.ipac.caltech.edu/
Acknowledgments
We are grateful to the anonymous referee for the detailed comments that helped us to improve this paper. We thank M. Bureau and F. Combes for their insightful comments and C. Buttitta for her help in the revision of the paper. VC acknowledges support by Fondazione Ing. Aldo Gini and thanks the Instituto de Astrofísica de Canarias, Universidad de la Laguna, and University of Central Lancashire for hospitality during the preparation of this paper. VC and EMC acknowledge support by Padua University through grants DOR1715817/17, DOR1885254/18, and DOR1935272/19. EMC is also supported by MIUR grant PRIN 2017 20173ML3WW_001. JALA is supported by the Spanish MINECO grant AYA2013-43188-P. VPD is supported by STFC Consolidated grant ST/R000786/1.
References
- Abazajian, K. N., Adelman-McCarthy, J. K., Agüeros, M. A., et al. 2009, ApJS, 182, 543 [NASA ADS] [CrossRef] [Google Scholar]
- Abolfathi, B., Aguado, D. S., Aguilar, G., et al. 2018, ApJS, 235, 42 [NASA ADS] [CrossRef] [Google Scholar]
- Aguerri, J. A. L. 1999, A&A, 351, 43 [NASA ADS] [Google Scholar]
- Aguerri, J. A. L., Muñoz-Tuñón, C., Varela, A. M., & Prieto, M. 2000, A&A, 361, 841 [NASA ADS] [Google Scholar]
- Aguerri, J. A. L., Debattista, V. P., & Corsini, E. M. 2003, MNRAS, 338, 465 [NASA ADS] [CrossRef] [Google Scholar]
- Aguerri, J. A. L., Méndez-Abreu, J., & Corsini, E. M. 2009, A&A, 495, 491 [NASA ADS] [CrossRef] [EDP Sciences] [Google Scholar]
- Aguerri, J. A. L., Méndez-Abreu, J., Falcón-Barroso, J., et al. 2015, A&A, 576, A102 [NASA ADS] [CrossRef] [EDP Sciences] [Google Scholar]
- Athanassoula, E. 1992, MNRAS, 259, 345 [NASA ADS] [CrossRef] [Google Scholar]
- Athanassoula, E. 2003, MNRAS, 341, 1179 [NASA ADS] [CrossRef] [Google Scholar]
- Athanassoula, E., & Martinet, L. 1980, A&A, 87, L10 [NASA ADS] [Google Scholar]
- Athanassoula, E., & Misiriotis, A. 2002, MNRAS, 330, 35 [NASA ADS] [CrossRef] [Google Scholar]
- Athanassoula, E., Lambert, J. C., & Dehnen, W. 2005, MNRAS, 363, 496 [NASA ADS] [CrossRef] [Google Scholar]
- Athanassoula, E., Machado, R. E. G., & Rodionov, S. A. 2013, MNRAS, 429, 1949 [NASA ADS] [CrossRef] [Google Scholar]
- Balcells, M., Benn, C. R., Carter, D., et al. 2010, in Society of Photo-Optical Instrumentation Engineers (SPIE) Conference Series, Proc. SPIE, 7735, 77357G [Google Scholar]
- Beckman, J. E., Font, J., Borlaff, A., & García-Lorenzo, B. 2018, ApJ, 854, 182 [CrossRef] [Google Scholar]
- Berentzen, I., Athanassoula, E., Heller, C. H., & Fricke, K. J. 2004, MNRAS, 347, 220 [NASA ADS] [CrossRef] [Google Scholar]
- Bland-Hawthorn, J., & Gerhard, O. 2016, ARA&A, 54, 529 [NASA ADS] [CrossRef] [EDP Sciences] [Google Scholar]
- Bundy, K., Bershady, M. A., Law, D. R., et al. 2015, ApJ, 798, 7 [NASA ADS] [CrossRef] [Google Scholar]
- Buta, R. J., & Zhang, X. 2009, ApJS, 182, 559 [NASA ADS] [CrossRef] [Google Scholar]
- Buta, R. J., Sheth, K., Athanassoula, E., et al. 2015, ApJS, 217, 32 [NASA ADS] [CrossRef] [Google Scholar]
- Combes, F., & Elmegreen, B. G. 1993, A&A, 271, 391 [NASA ADS] [Google Scholar]
- Comerón, S., Salo, H., Laurikainen, E., et al. 2014, A&A, 562, A121 [NASA ADS] [CrossRef] [EDP Sciences] [Google Scholar]
- Consolandi, G. 2016, A&A, 595, A67 [NASA ADS] [CrossRef] [EDP Sciences] [Google Scholar]
- Contopoulos, G. 1980, A&A, 81, 198 [NASA ADS] [Google Scholar]
- Corsini, E. M. 2011, Mem. Soc. Astron. It. Suppl., 18, 23 [Google Scholar]
- Corsini, E. M., Debattista, V. P., & Aguerri, J. A. L. 2003, ApJ, 599, L29 [NASA ADS] [CrossRef] [Google Scholar]
- Corsini, E. M., Aguerri, J. A. L., Debattista, V. P., et al. 2007, ApJ, 659, L121 [NASA ADS] [CrossRef] [Google Scholar]
- Costantin, L., Méndez-Abreu, J., Corsini, E. M., et al. 2020, ApJ, 889, L3 [CrossRef] [Google Scholar]
- Croom, S. M., Lawrence, J. S., Bland-Hawthorn, J., et al. 2012, MNRAS, 421, 872 [NASA ADS] [Google Scholar]
- Cuomo, V., Corsini, E. M., Aguerri, J. A. L., et al. 2019a, MNRAS, 488, 4972 [NASA ADS] [Google Scholar]
- Cuomo, V., Aguerri, J. A. L., Corsini, E. M., et al. 2019b, A&A, 632, A51 [CrossRef] [EDP Sciences] [Google Scholar]
- Cuomo, V., Corsini, E. M., Aguerri, A. J. L., & Debattista, V. P. 2020, in IAU Symposium, eds. M. Valluri, & J. A. Sellwood, 353, 172 [Google Scholar]
- Debattista, V. P. 2003, MNRAS, 342, 1194 [NASA ADS] [CrossRef] [Google Scholar]
- Debattista, V. P., & Sellwood, J. A. 1998, ApJ, 493, L5 [NASA ADS] [CrossRef] [Google Scholar]
- Debattista, V. P., & Sellwood, J. A. 2000, ApJ, 543, 704 [NASA ADS] [CrossRef] [Google Scholar]
- Debattista, V. P., & Williams, T. B. 2004, ApJ, 605, 714 [NASA ADS] [CrossRef] [Google Scholar]
- Debattista, V. P., Corsini, E. M., & Aguerri, J. A. L. 2002, MNRAS, 332, 65 [NASA ADS] [CrossRef] [Google Scholar]
- Debattista, V. P., Carollo, C. M., Mayer, L., & Moore, B. 2005, ApJ, 628, 678 [NASA ADS] [CrossRef] [Google Scholar]
- Dehnen, W. 2000, AJ, 119, 800 [NASA ADS] [CrossRef] [Google Scholar]
- Díaz-García, S., Salo, H., & Laurikainen, E. 2016a, A&A, 596, A84 [NASA ADS] [CrossRef] [EDP Sciences] [Google Scholar]
- Díaz-García, S., Salo, H., Laurikainen, E., & Herrera-Endoqui, M. 2016b, A&A, 587, A160 [NASA ADS] [CrossRef] [EDP Sciences] [Google Scholar]
- Díaz-García, S., Salo, H., Knapen, J. H., & Herrera-Endoqui, M. 2019, A&A, 631, A94 [NASA ADS] [CrossRef] [EDP Sciences] [Google Scholar]
- D’Onghia, E., & Aguerri, L. J. A. 2020, ApJ, 890, 117 [CrossRef] [Google Scholar]
- Drory, N., MacDonald, N., Bershady, M. A., et al. 2015, AJ, 149, 77 [NASA ADS] [CrossRef] [Google Scholar]
- Elmegreen, B. G., & Elmegreen, D. M. 1985, ApJ, 288, 438 [NASA ADS] [CrossRef] [Google Scholar]
- Elmegreen, B. G., Elmegreen, D. M., Chromey, F. R., Hasselbacher, D. A., & Bissell, B. A. 1996, AJ, 111, 2233 [NASA ADS] [CrossRef] [Google Scholar]
- Elmegreen, B. G., Elmegreen, D. M., Knapen, J. H., et al. 2007, ApJ, 670, L97 [NASA ADS] [CrossRef] [Google Scholar]
- Erwin, P. 2005, MNRAS, 364, 283 [NASA ADS] [CrossRef] [Google Scholar]
- Erwin, P. 2018, MNRAS, 474, 5372 [NASA ADS] [CrossRef] [Google Scholar]
- Erwin, P. 2019, MNRAS, 489, 3553 [CrossRef] [Google Scholar]
- Font, J., Beckman, J. E., Martínez-Valpuesta, I., et al. 2017, ApJ, 835, 279 [NASA ADS] [CrossRef] [Google Scholar]
- Fragkoudi, F., Katz, D., Trick, W., et al. 2019, MNRAS, 488, 3324 [NASA ADS] [Google Scholar]
- Fukugita, M., Ichikawa, T., Gunn, J. E., et al. 1996, AJ, 111, 1748 [NASA ADS] [CrossRef] [Google Scholar]
- Gadotti, D. A. 2011, MNRAS, 415, 3308 [NASA ADS] [CrossRef] [Google Scholar]
- Garma-Oehmichen, L., Cano-Díaz, M., Hernández-Toledo, H., et al. 2020, MNRAS, 491, 3655 [Google Scholar]
- Gerssen, J., & Debattista, V. P. 2007, MNRAS, 378, 189 [NASA ADS] [CrossRef] [Google Scholar]
- Gerssen, J., Kuijken, K., & Merrifield, M. R. 1999, MNRAS, 306, 926 [NASA ADS] [CrossRef] [Google Scholar]
- Gerssen, J., Kuijken, K., & Merrifield, M. R. 2003, MNRAS, 345, 261 [NASA ADS] [CrossRef] [Google Scholar]
- Guo, R., Mao, S., Athanassoula, E., et al. 2019, MNRAS, 482, 1733 [NASA ADS] [CrossRef] [Google Scholar]
- Hernquist, L., & Weinberg, M. D. 1992, ApJ, 400, 80 [NASA ADS] [CrossRef] [Google Scholar]
- Herrera-Endoqui, M., Díaz-García, S., Laurikainen, E., & Salo, H. 2015, A&A, 582, A86 [NASA ADS] [CrossRef] [EDP Sciences] [Google Scholar]
- Hilmi, T., Minchev, I., Buck, T., et al. 2020, MNRAS, 497, 933 [CrossRef] [Google Scholar]
- Hinshaw, G., Larson, D., Komatsu, E., et al. 2013, ApJS, 208, 19 [NASA ADS] [CrossRef] [Google Scholar]
- James, P. A., & Percival, S. M. 2018, MNRAS, 474, 3101 [NASA ADS] [CrossRef] [Google Scholar]
- Kataria, S. K., & Das, M. 2019, ApJ, 886, 43 [CrossRef] [Google Scholar]
- Kim, T., Gadotti, D. A., Athanassoula, E., et al. 2016a, MNRAS, 462, 3430 [NASA ADS] [CrossRef] [Google Scholar]
- Kim, T., Gadotti, D. A., Sheth, K., et al. 2016b, VizieR Online Data Catalog: J/ApJ/782/64 [Google Scholar]
- Kim, E., Hwang, H. S., Chung, H., et al. 2017, ApJ, 845, 93 [NASA ADS] [CrossRef] [Google Scholar]
- Kormendy, J. 2013, in Secular Evolution in Disk Galaxies, eds. J. Falcón-Barroso, & J. H. Knapen (Cambridge, UK: Cambridge University Press) [Google Scholar]
- Kruk, S. J., Lintott, C. J., Bamford, S. P., et al. 2018, MNRAS, 473, 4731 [NASA ADS] [CrossRef] [Google Scholar]
- Laurikainen, E., & Salo, H. 2017, A&A, 598, A10 [NASA ADS] [CrossRef] [EDP Sciences] [Google Scholar]
- Laurikainen, E., Salo, H., Buta, R., & Knapen, J. H. 2007, MNRAS, 381, 401 [NASA ADS] [CrossRef] [Google Scholar]
- Laurikainen, E., Salo, H., Buta, R., Knapen, J. H., & Comerón, S. 2010, MNRAS, 405, 1089 [NASA ADS] [Google Scholar]
- Lee, Y. H., Ann, H. B., & Park, M.-G. 2019, ApJ, 872, 97 [NASA ADS] [CrossRef] [Google Scholar]
- Lin, Y., Cervantes Sodi, B., Li, C., Wang, L., & Wang, E. 2014, ApJ, 796, 98 [NASA ADS] [CrossRef] [Google Scholar]
- Lintott, C. J., Schawinski, K., Slosar, A., et al. 2008, MNRAS, 389, 1179 [NASA ADS] [CrossRef] [Google Scholar]
- Little, B., & Carlberg, R. G. 1991, MNRAS, 251, 227 [NASA ADS] [CrossRef] [Google Scholar]
- Łokas, E. L. 2018, ApJ, 857, 6 [NASA ADS] [CrossRef] [Google Scholar]
- Łokas, E. L., Athanassoula, E., Debattista, V. P., et al. 2014, MNRAS, 445, 1339 [NASA ADS] [CrossRef] [Google Scholar]
- Lynden-Bell, D., & Kalnajs, A. J. 1972, MNRAS, 157, 1 [Google Scholar]
- Marinova, I., & Jogee, S. 2007, ApJ, 659, 1176 [NASA ADS] [CrossRef] [Google Scholar]
- Martinez-Valpuesta, I., Knapen, J. H., & Buta, R. 2007, AJ, 134, 1863 [NASA ADS] [CrossRef] [Google Scholar]
- Martinez-Valpuesta, I., Aguerri, J. A. L., González-García, A. C., Dalla Vecchia, C., & Stringer, M. 2017, MNRAS, 464, 1502 [NASA ADS] [CrossRef] [Google Scholar]
- Meidt, S. E., Rand, R. J., Merrifield, M. R., Debattista, V. P., & Shen, J. 2008a, ApJ, 676, 899 [NASA ADS] [CrossRef] [Google Scholar]
- Meidt, S. E., Rand, R. J., Merrifield, M. R., Shetty, R., & Vogel, S. N. 2008b, ApJ, 688, 224 [NASA ADS] [CrossRef] [Google Scholar]
- Méndez-Abreu, J., Sánchez-Janssen, R., & Aguerri, J. A. L. 2010, ApJ, 711, L61 [NASA ADS] [CrossRef] [Google Scholar]
- Méndez-Abreu, J., Sánchez-Janssen, R., Aguerri, J. A. L., Corsini, E. M., & Zarattini, S. 2012, ApJ, 761, L6 [NASA ADS] [CrossRef] [Google Scholar]
- Méndez-Abreu, J., Ruiz-Lara, T., Sánchez-Menguiano, L., et al. 2017, A&A, 598, A32 [NASA ADS] [CrossRef] [EDP Sciences] [Google Scholar]
- Menéndez-Delmestre, K., Sheth, K., Schinnerer, E., Jarrett, T. H., & Scoville, N. Z. 2007, ApJ, 657, 790 [NASA ADS] [CrossRef] [Google Scholar]
- Merrifield, M. R., & Kuijken, K. 1995, MNRAS, 274, 933 [NASA ADS] [CrossRef] [Google Scholar]
- Neumann, J., Fragkoudi, F., Pérez, I., et al. 2020, A&A, 637, A56 [CrossRef] [EDP Sciences] [Google Scholar]
- Petersen, M. S., Weinberg, M. D., & Katz, N. 2019, MNRAS, submitted [arXiv:1903.08203] [Google Scholar]
- Portail, M., Wegg, C., Gerhard, O., & Ness, M. 2017, MNRAS, 470, 1233 [NASA ADS] [CrossRef] [Google Scholar]
- Press, W. H., Teukolsky, S. A., Vetterling, W. T., & Flannery, B. P. 1992, Numerical Recipes. The Art of Scientific Computing, 2nd edn. (Cambridge, UK: Cambridge University Press) [Google Scholar]
- Rautiainen, P., Salo, H., & Laurikainen, E. 2008, MNRAS, 388, 1803 [NASA ADS] [CrossRef] [Google Scholar]
- Saha, K., Gerhard, O., & Martinez-Valpuesta, I. 2016, A&A, 588, A42 [NASA ADS] [CrossRef] [EDP Sciences] [Google Scholar]
- Salo, H., Laurikainen, E., Laine, J., et al. 2015, ApJS, 219, 4 [NASA ADS] [CrossRef] [Google Scholar]
- Sánchez, S. F., Kennicutt, R. C., Gil de Paz, A., et al. 2012, A&A, 538, A8 [NASA ADS] [CrossRef] [EDP Sciences] [Google Scholar]
- Sanchez-Janssen, R., & Gadotti, D. A. 2013, MNRAS, 432, L56 [NASA ADS] [CrossRef] [Google Scholar]
- Scoville, N., Aussel, H., Brusa, M., et al. 2007, ApJS, 172, 1 [NASA ADS] [CrossRef] [Google Scholar]
- Sellwood, J. A. 1981, A&A, 99, 362 [NASA ADS] [Google Scholar]
- Sellwood, J. A. 2006, ApJ, 637, 567 [NASA ADS] [CrossRef] [Google Scholar]
- Sellwood, J. A., & Debattista, V. P. 2006, ApJ, 639, 868 [NASA ADS] [CrossRef] [Google Scholar]
- Sellwood, J. A., & Sparke, L. S. 1988, MNRAS, 231, 25 [NASA ADS] [CrossRef] [Google Scholar]
- Sheth, K., Elmegreen, D. M., Elmegreen, B. G., et al. 2008, ApJ, 675, 1141 [NASA ADS] [CrossRef] [Google Scholar]
- Sheth, K., Regan, M., Hinz, J. L., et al. 2010, PASP, 122, 1397 [NASA ADS] [CrossRef] [Google Scholar]
- Sygnet, J. F., Tagger, M., Athanassoula, E., & Pellat, R. 1988, MNRAS, 232, 733 [NASA ADS] [CrossRef] [Google Scholar]
- Tagger, M., Sygnet, J. F., Athanassoula, E., & Pellat, R. 1987, ApJ, 318, L43 [NASA ADS] [CrossRef] [Google Scholar]
- Tremaine, S., & Weinberg, M. D. 1984a, ApJ, 282, L5 [Google Scholar]
- Tremaine, S., & Weinberg, M. D. 1984b, MNRAS, 209, 729 [NASA ADS] [CrossRef] [Google Scholar]
- Treuthardt, P., Buta, R., Salo, H., & Laurikainen, E. 2007, AJ, 134, 1195 [NASA ADS] [CrossRef] [Google Scholar]
- Tully, R. B., & Fisher, J. R. 1977, A&A, 500, 105 [Google Scholar]
- Vasiliev, E., & Valluri, M. 2020, ApJ, 889, 39 [CrossRef] [Google Scholar]
- Villa-Vargas, J., Shlosman, I., & Heller, C. 2010, ApJ, 719, 1470 [NASA ADS] [CrossRef] [Google Scholar]
- Wake, D. A., Bundy, K., Diamond-Stanic, A. M., et al. 2017, AJ, 154, 86 [NASA ADS] [CrossRef] [Google Scholar]
- Walcher, C. J., Wisotzki, L., Bekeraité, S., et al. 2014, A&A, 569, A1 [NASA ADS] [CrossRef] [EDP Sciences] [Google Scholar]
- Wang, J., Athanassoula, E., Yu, S.-Y., et al. 2020, ApJ, 893, 19 [CrossRef] [Google Scholar]
- Weinberg, M. D. 1985, MNRAS, 213, 451 [NASA ADS] [CrossRef] [Google Scholar]
- Yan, R., Bundy, K., Law, D. R., et al. 2016, AJ, 152, 197 [NASA ADS] [CrossRef] [Google Scholar]
- Zou, Y., Shen, J., Bureau, M., & Li, Z.-Y. 2019, ApJ, 884, 23 [CrossRef] [Google Scholar]
Appendix A: Properties of galaxies
We tabulated here all the parameters used in this work collected for our parent sample of 104 galaxies.
Properties of the 18 galaxies in the literature subsample.
Properties of the 31 galaxies in the CALIFA subsample.
Properties of the 55 galaxies in the MaNGA subsample.
Appendix B: Spearman parameters of the explored correlations
We tabulate the Spearman parameters of the explored correlations within the properties of the galaxies.
Spearman parameters of the explored correlations within the properties of the galaxies.
Appendix C: Relations among the bar parameters in ETBGs and LTBGs
We plot the relations after splitting the final sample between ETBGs and LTBGs.
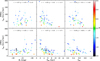 |
Fig. C.1. Top panels: relations between the bar pattern speed Ωbar and the SDSS r-band absolute magnitude Mr, bar radius Rbar, and bar strength Sbar for the subsample of 34 ETBGs. Bottom panels: same as above, but for the subsample of 43 LTBGs. The Spearman rank correlation r, the two-sided significance p, and the number of σ from the null hypothesis are given in each panel. The points are colour-coded according to the value of ℛ. Results obtained using different bands with respect to the SDSS r-band are shown as a square symbol. The results for the Milky Way are shown both for the short bar case (black open diamond) and long bar case (black open square). |
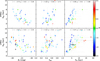 |
Fig. C.2. Top panels: relations between the bar radius Rbar and the absolute SDSS r-band magnitude Mr, bar strength Sbar, and corotation radius Rcr for the subsample of 34 ETBGs. Bottom panels: same as above, but for the subsample of 43 LTBGs. The Spearman rank correlation r, two-sided significance p, and number of σ from the null hypothesis are given in each panel. The points are colour-coded according to the value of ℛ. Results obtained using different bands with respect to the SDSS r-band are shown as a square symbol. The results for the Milky Way are shown both for the short bar case (black open diamond) and long bar case (black open square). |
Appendix D: Scaled relations involving the sizes of galaxies
We plot the relations shown in the third panel of Figs. 4 and 5 after scaling the sizes of the galaxies with RPetro.
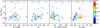 |
Fig. D.1. Relations between the bar radius Rbar normalised by RPetro, and the absolute SDSS r-band magnitude Mr, bar strength Sbar, bar pattern speed Ωbar, and corotation radius Rcr normalised by RPetro, for the subsample of 66 galaxies for which we have RPetro. The Spearman rank correlation r, the two-sided significance p, and number of σ from the null hypothesis are given in each panel. The points are colour-coded according to the value of ℛ. Results obtained using different bands with respect to the SDSS r-band are shown as a square symbol. The results for the Milky Way are shown both for the short bar case (black open diamond) and long bar case (black open square). |
All Tables
Mean value and corresponding standard deviation in parenthesis of the bar parameters for the final sample of 77 objects, for the 34 ETBGs, and for the 43 LTBGs.
Spearman parameters of the explored correlations within the properties of the galaxies.
All Figures
|
Fig. 1. Distributions of Hubble types, redshifts z, and SDSS r-band absolute magnitudes Mr of the full sample of 104 galaxies (black solid line), literature subsample (green dot-dashed line), CALIFA subsample (red dotted line), and MaNGA subsample (blue dashed line). |
| In the text | |
|
Fig. 2. Relative errors on the bar pattern speed ΔΩbar/Ωbar, bar radius ΔRbar/Rbar, and corotation radius ΔRcr/Rcr as a function of the disc inclination i. Ultrafast bars are highlighted (black filled points). Galaxies with relative errors larger than 100% are not shown. |
| In the text | |
|
Fig. 3. As in Fig. 2, but as a function of the bar orientation with respect to the disc major and minor axes ΔPA, given as the absolute value of the difference between the PA of the bar and that of the axes on the sky plane. |
| In the text | |
|
Fig. 4. Relations between the bar pattern speed Ωbar and the Hubble type, SDSS r-band absolute magnitude Mr, bar radius Rbar, and bar strength Sbar for the selected sample of 77 galaxies. The Spearman rank correlation r, two-sided significance p, and number of σ from the null hypothesis are given in each panel. The points are colour-coded according to the value of ℛ. Results obtained using different bands with respect to the SDSS r-band are represented with a square symbol. The mean value of Ωbar for each bin of Hubble type is shown (black filled stars). The results for the Milky Way are shown both for the short bar case (black open diamond) and long bar case (black open square). |
| In the text | |
|
Fig. 5. Relations between the bar radius Rbar and the SDSS r-band absolute magnitude Mr, bar strength Sbar, and corotation radius Rcr for the selected sample of 77 galaxies. The Spearman rank correlation r, two-sided significance p, and number of σ from the null hypothesis are given in each panel for the selected sample of 77 galaxies. The points are colour-coded according to the value of ℛ. Results obtained using different bands with respect to the SDSS r-band are represented with a square symbol. The results for the Milky Way are shown both for the short bar case (black open diamond) and long bar case (black open square). |
| In the text | |
|
Fig. 6. Relation between the bulge-to-total luminosity ratio B/T and bar strength Sbar for the subsample of 41 galaxies with a photometric decomposition. The Spearman rank correlation r, the two-sided significance p, and number of σ from the null hypothesis are given. The points are colour-coded according to the value of ℛ. Results obtained using different bands with respect to the SDSS r-band are represented with a square symbol. |
| In the text | |
|
Fig. C.1. Top panels: relations between the bar pattern speed Ωbar and the SDSS r-band absolute magnitude Mr, bar radius Rbar, and bar strength Sbar for the subsample of 34 ETBGs. Bottom panels: same as above, but for the subsample of 43 LTBGs. The Spearman rank correlation r, the two-sided significance p, and the number of σ from the null hypothesis are given in each panel. The points are colour-coded according to the value of ℛ. Results obtained using different bands with respect to the SDSS r-band are shown as a square symbol. The results for the Milky Way are shown both for the short bar case (black open diamond) and long bar case (black open square). |
| In the text | |
|
Fig. C.2. Top panels: relations between the bar radius Rbar and the absolute SDSS r-band magnitude Mr, bar strength Sbar, and corotation radius Rcr for the subsample of 34 ETBGs. Bottom panels: same as above, but for the subsample of 43 LTBGs. The Spearman rank correlation r, two-sided significance p, and number of σ from the null hypothesis are given in each panel. The points are colour-coded according to the value of ℛ. Results obtained using different bands with respect to the SDSS r-band are shown as a square symbol. The results for the Milky Way are shown both for the short bar case (black open diamond) and long bar case (black open square). |
| In the text | |
|
Fig. D.1. Relations between the bar radius Rbar normalised by RPetro, and the absolute SDSS r-band magnitude Mr, bar strength Sbar, bar pattern speed Ωbar, and corotation radius Rcr normalised by RPetro, for the subsample of 66 galaxies for which we have RPetro. The Spearman rank correlation r, the two-sided significance p, and number of σ from the null hypothesis are given in each panel. The points are colour-coded according to the value of ℛ. Results obtained using different bands with respect to the SDSS r-band are shown as a square symbol. The results for the Milky Way are shown both for the short bar case (black open diamond) and long bar case (black open square). |
| In the text | |
Current usage metrics show cumulative count of Article Views (full-text article views including HTML views, PDF and ePub downloads, according to the available data) and Abstracts Views on Vision4Press platform.
Data correspond to usage on the plateform after 2015. The current usage metrics is available 48-96 hours after online publication and is updated daily on week days.
Initial download of the metrics may take a while.