Free Access
Fig. 7.
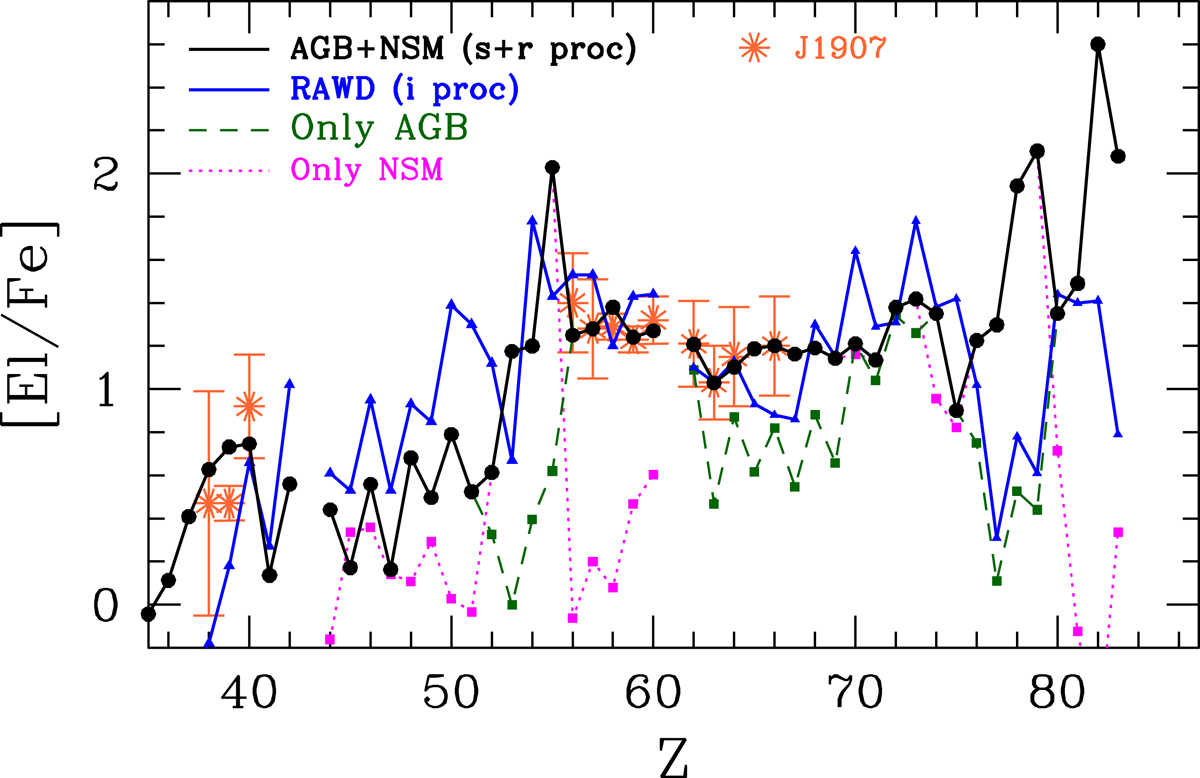
Abundance pattern of J1907 compared with yields from a NMS (magenta dotted curve), an AGB star (green dashed curve), a combination of them (black solid curve) and RAWDs (blue solid curve). See text for details.
Current usage metrics show cumulative count of Article Views (full-text article views including HTML views, PDF and ePub downloads, according to the available data) and Abstracts Views on Vision4Press platform.
Data correspond to usage on the plateform after 2015. The current usage metrics is available 48-96 hours after online publication and is updated daily on week days.
Initial download of the metrics may take a while.