Fig. 5.
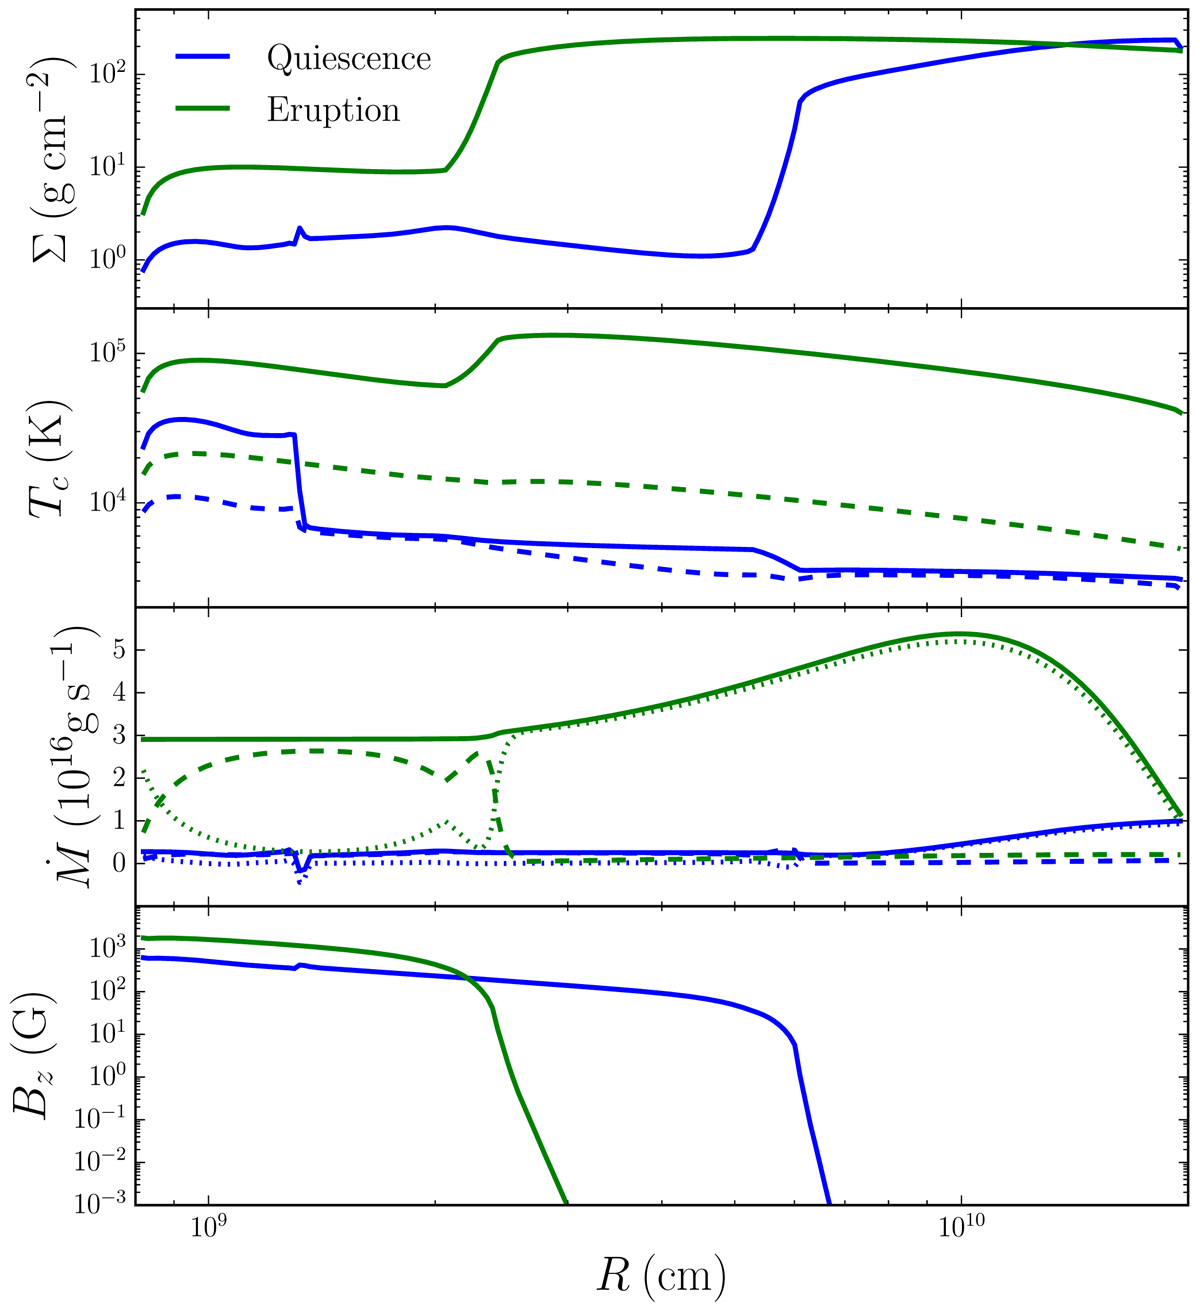
Surface density (first panel), temperature (second panel), total mass accretion rate (third panel), and vertical magnetic field (fourth panel) as a function of radius in eruption (green curves) and quiescence (blue curves). The dashed curves in the second panel represent the effective temperature of the disk. The dashed curves in the third panel represent the outflow-driven mass accretion rate and the dotted curves represent the turbulent-driven mass accretion rate. The initial magnetic field is uniform with Bz = 10 G.
Current usage metrics show cumulative count of Article Views (full-text article views including HTML views, PDF and ePub downloads, according to the available data) and Abstracts Views on Vision4Press platform.
Data correspond to usage on the plateform after 2015. The current usage metrics is available 48-96 hours after online publication and is updated daily on week days.
Initial download of the metrics may take a while.