Fig. 9.

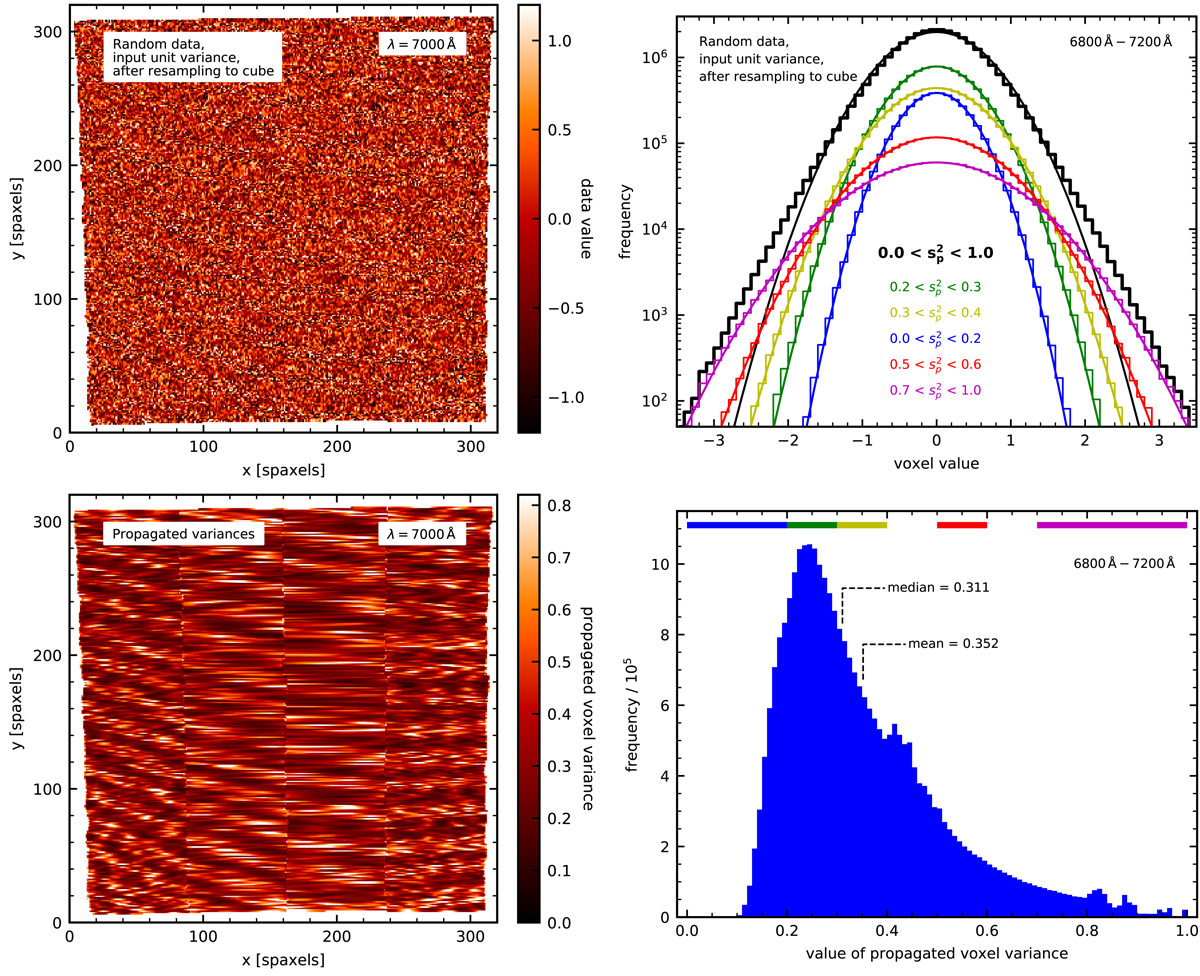
Behavior of the propagated variances ![]() after resampling a pixel table with pure random data of unit variance into a datacube. Upper left panel: single wavelength plane of this cube; the same plane of the corresponding variance cube is shown below. Upper right panel: histograms of the resampled random data evaluated over a subcube of 320 planes (400 Å) bandwidth, together with Gaussian fits to these histograms. Each of the colored curves represent a different subset of voxels selected by a specific range of the propagated variances in these voxels, as indicated by the labels. Lower right panel: histogram of the propagated variances, for the same subcube. The colored horizontal bar in the top indicates the selected variance ranges.
after resampling a pixel table with pure random data of unit variance into a datacube. Upper left panel: single wavelength plane of this cube; the same plane of the corresponding variance cube is shown below. Upper right panel: histograms of the resampled random data evaluated over a subcube of 320 planes (400 Å) bandwidth, together with Gaussian fits to these histograms. Each of the colored curves represent a different subset of voxels selected by a specific range of the propagated variances in these voxels, as indicated by the labels. Lower right panel: histogram of the propagated variances, for the same subcube. The colored horizontal bar in the top indicates the selected variance ranges.
Current usage metrics show cumulative count of Article Views (full-text article views including HTML views, PDF and ePub downloads, according to the available data) and Abstracts Views on Vision4Press platform.
Data correspond to usage on the plateform after 2015. The current usage metrics is available 48-96 hours after online publication and is updated daily on week days.
Initial download of the metrics may take a while.


