Fig. 7.
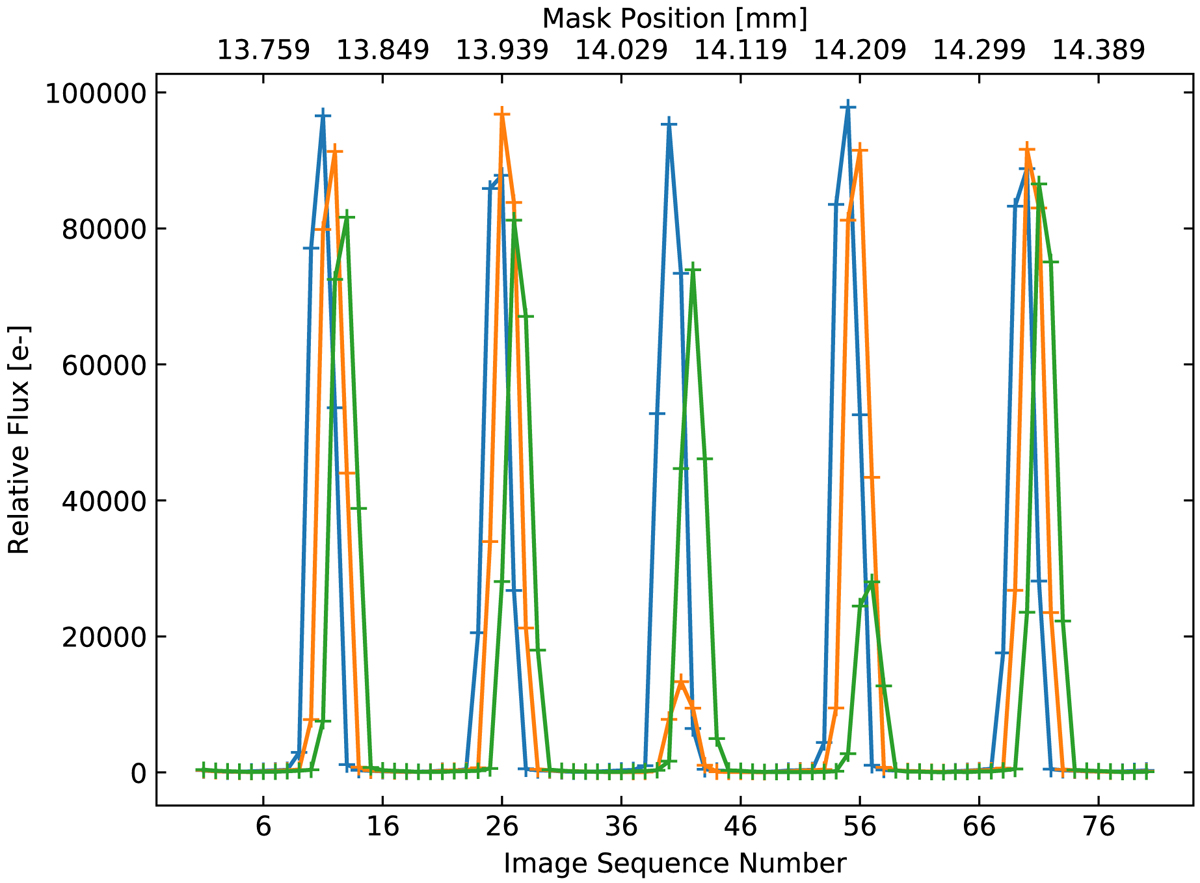
Relative illumination of slice 10 of IFU 10 from the geometrical calibration sequence taken on 2015-12-03. The measurements are from the arc line Ne I 6383. The three colors represent the fluxes measured for the three different pinholes (see Fig. 6) that illuminate the slice. The slice is illuminated by the pinholes five times. Since the peaks occur at different positions for the different pinholes, it is already possible to determine that the slice is tilted in the MUSE FOV, by 0.773° in this case. Two of the pinholes are dirty, so that the orange peak near exposure 40 and the green peak at exposure 56 reach lower flux levels.
Current usage metrics show cumulative count of Article Views (full-text article views including HTML views, PDF and ePub downloads, according to the available data) and Abstracts Views on Vision4Press platform.
Data correspond to usage on the plateform after 2015. The current usage metrics is available 48-96 hours after online publication and is updated daily on week days.
Initial download of the metrics may take a while.