Fig. 6.
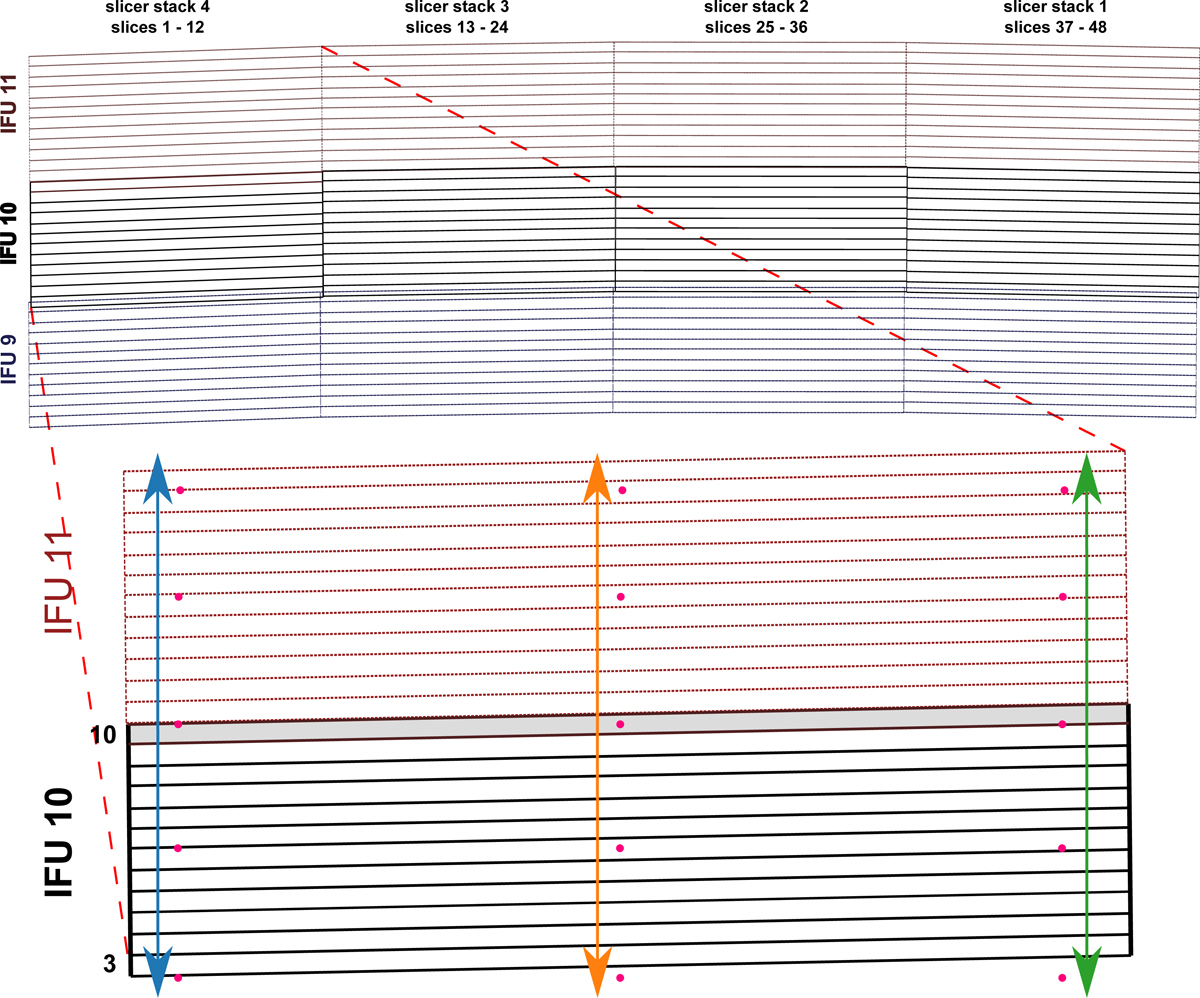
Sketch of the geometry of selected IFUs. The four stacks of slices are indicated in the top figure which shows three selected IFUs of MUSE. The upper part shows that IFUs 9 and 10 partially overlap in projection to the VLT focal plane; these IFUs are also significantly offset horizontally. The lower part displays the approximate location of the pinholes (the pink dots) relative to the slices of the leftmost slicer stack in two of those IFUs. Slice 10 of IFU 10 is highlighted with a gray background. During the exposure sequence, the pinholes are moved vertically, the arrows represent the motion that resulted in the flux distribution depicted in Fig. 7, where the curves are displayed in the same color for the same pinhole.
Current usage metrics show cumulative count of Article Views (full-text article views including HTML views, PDF and ePub downloads, according to the available data) and Abstracts Views on Vision4Press platform.
Data correspond to usage on the plateform after 2015. The current usage metrics is available 48-96 hours after online publication and is updated daily on week days.
Initial download of the metrics may take a while.