Fig. 5.
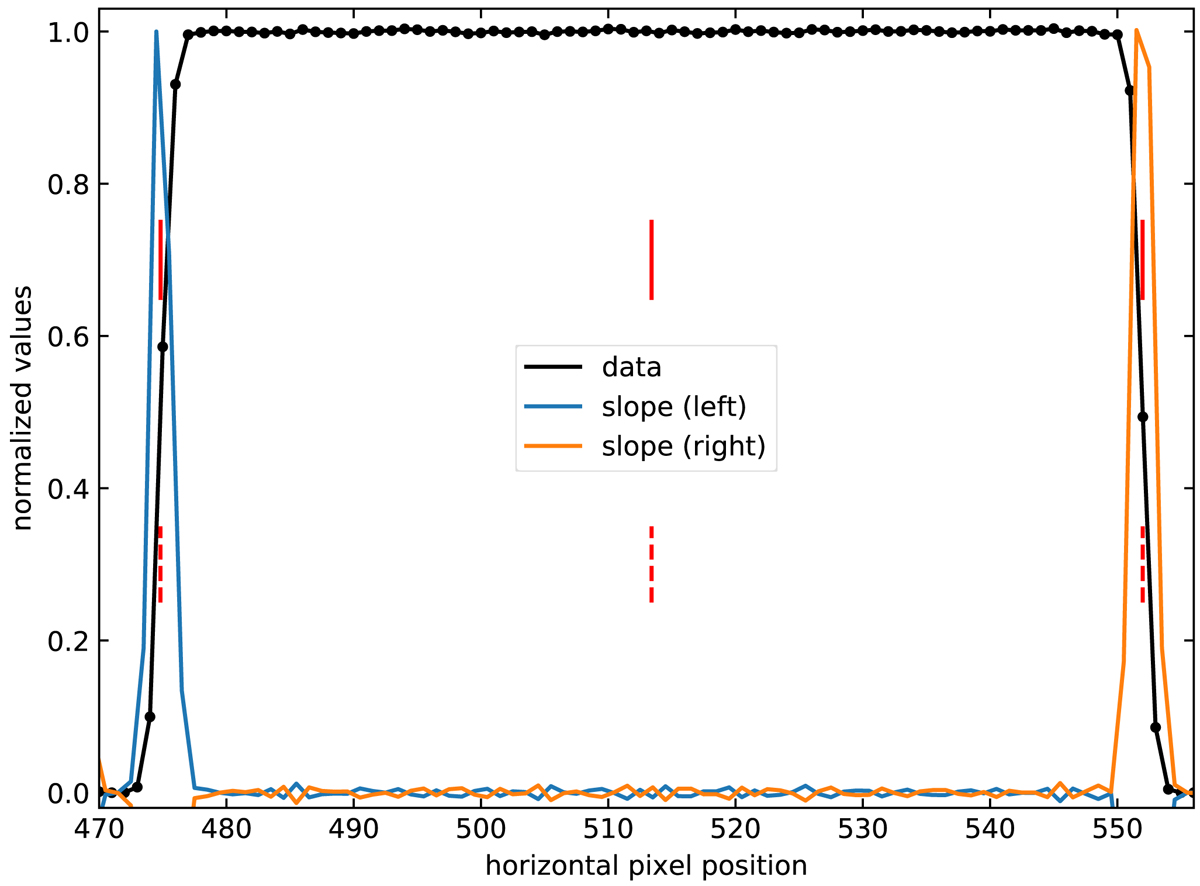
Tracing procedure and edge refinement. Shown is a cut through a MUSE slice at the CCD level, illuminated by a flat-field lamp. The data itself is displayed normalized to the constant region in between the edges (black). The slope of the data for the left edge (blue) and the right edge (orange) are displayed as well. The original trace position (vertical dashed red lines) and the refined edges (solid red lines) are also shown. In this case the refinement shifted the positions by less than 0.1 pixels.
Current usage metrics show cumulative count of Article Views (full-text article views including HTML views, PDF and ePub downloads, according to the available data) and Abstracts Views on Vision4Press platform.
Data correspond to usage on the plateform after 2015. The current usage metrics is available 48-96 hours after online publication and is updated daily on week days.
Initial download of the metrics may take a while.