Fig. 4.
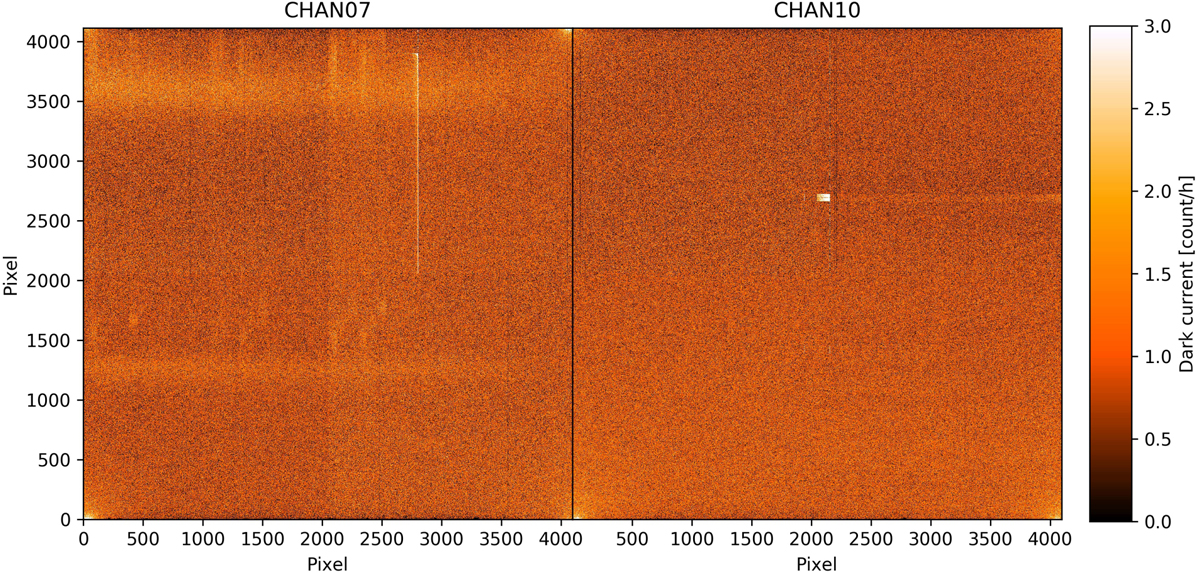
Master dark images for two MUSE CCDs, both combined from 149 raw dark images taken between 2018-06-25T11:20:47 and 2018-08-21T06:56:51. The CCD of channel 7 shows broad horizontal stripes, while the CCD of channel 10 shows a noticeable block of hot pixels. The location of the hot corners is different for both CCDs, and while channel 10 shows a vertical gradient seen in most MUSE CCDs, this is less apparent for the CCD in channel 7.
Current usage metrics show cumulative count of Article Views (full-text article views including HTML views, PDF and ePub downloads, according to the available data) and Abstracts Views on Vision4Press platform.
Data correspond to usage on the plateform after 2015. The current usage metrics is available 48-96 hours after online publication and is updated daily on week days.
Initial download of the metrics may take a while.