Fig. 3.
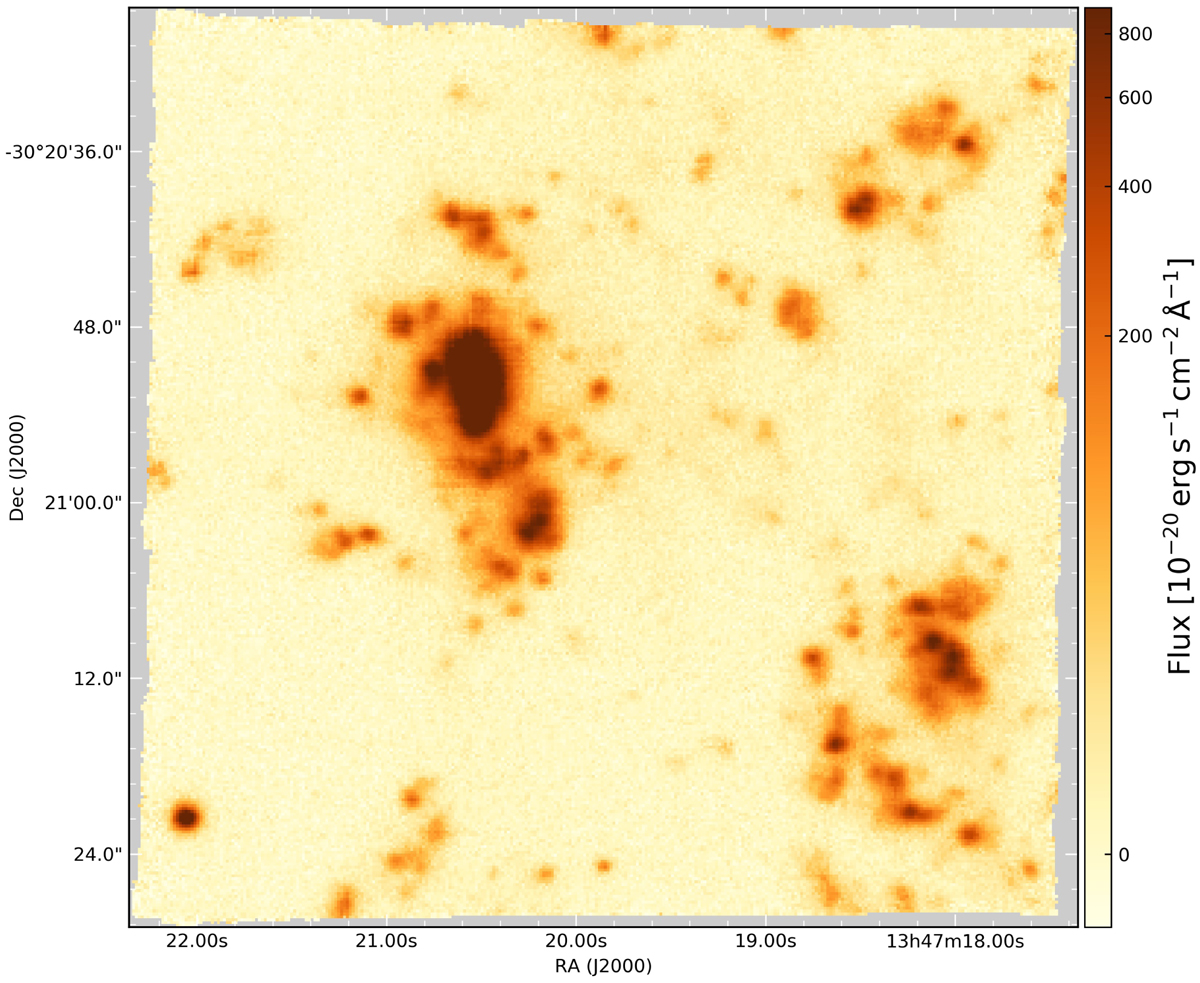
Reduced science data. A combination of three science exposures taken on 2014-06-26 between 1:00 and 2:00 UTC, including the image displayed in Fig. 2. This image shows a cut of the datacube at the wavelength of Hα (redshifted to 6653.6 Å) displayed in negative arcsinh scaling. Regions at the edge that were not covered by the MUSE data are displayed in light gray.
Current usage metrics show cumulative count of Article Views (full-text article views including HTML views, PDF and ePub downloads, according to the available data) and Abstracts Views on Vision4Press platform.
Data correspond to usage on the plateform after 2015. The current usage metrics is available 48-96 hours after online publication and is updated daily on week days.
Initial download of the metrics may take a while.