Fig. 2.
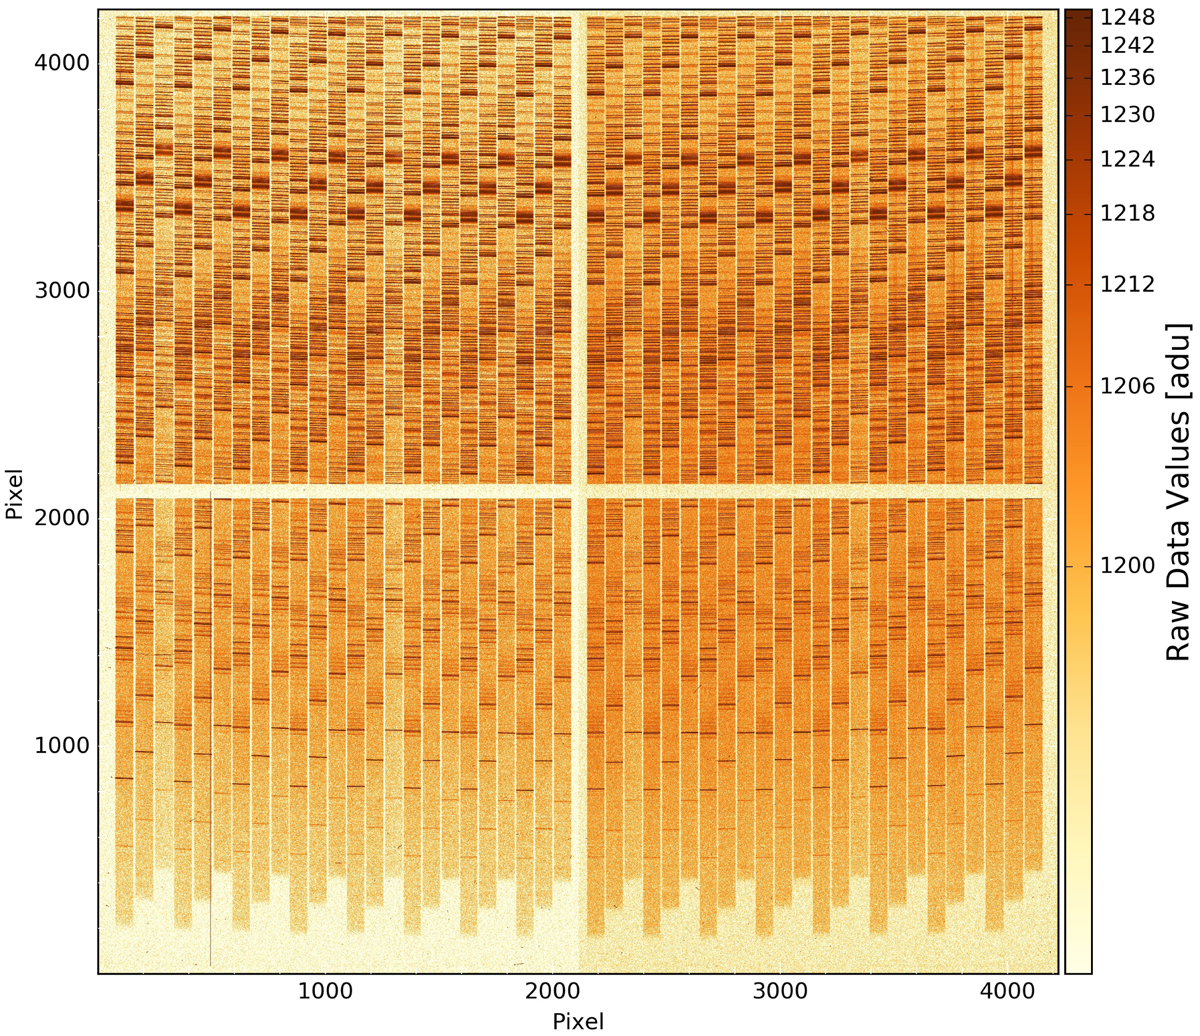
Raw science data of one of the 24 CCDs, displayed in negative arcsinh scaling. This shows the data of IFU 10 of the exposure started at 2014-06-26T01:24:23 (during MUSE Science Verification). The 48 slices of the IFU are the stripes oriented almost vertically, which appear dark in this representation. The blue end of the MUSE wavelength range is located at the bottom, the red limit near the top; the step-pattern is created by the geometry of the image slicer. Since this was a 600 s exposure, the sky emission and continuum dominate over the relatively faint object signal in this part of the cube. The overscan regions of the CCDs are creating the cross in the center of the image; the pre-scan regions are the empty borders. This exposure was taken in nominal mode (WFM-NOAO-N), the second-order blocking filter removed the blue light so that the bottom part of the image appears empty.
Current usage metrics show cumulative count of Article Views (full-text article views including HTML views, PDF and ePub downloads, according to the available data) and Abstracts Views on Vision4Press platform.
Data correspond to usage on the plateform after 2015. The current usage metrics is available 48-96 hours after online publication and is updated daily on week days.
Initial download of the metrics may take a while.