Fig. B.1.
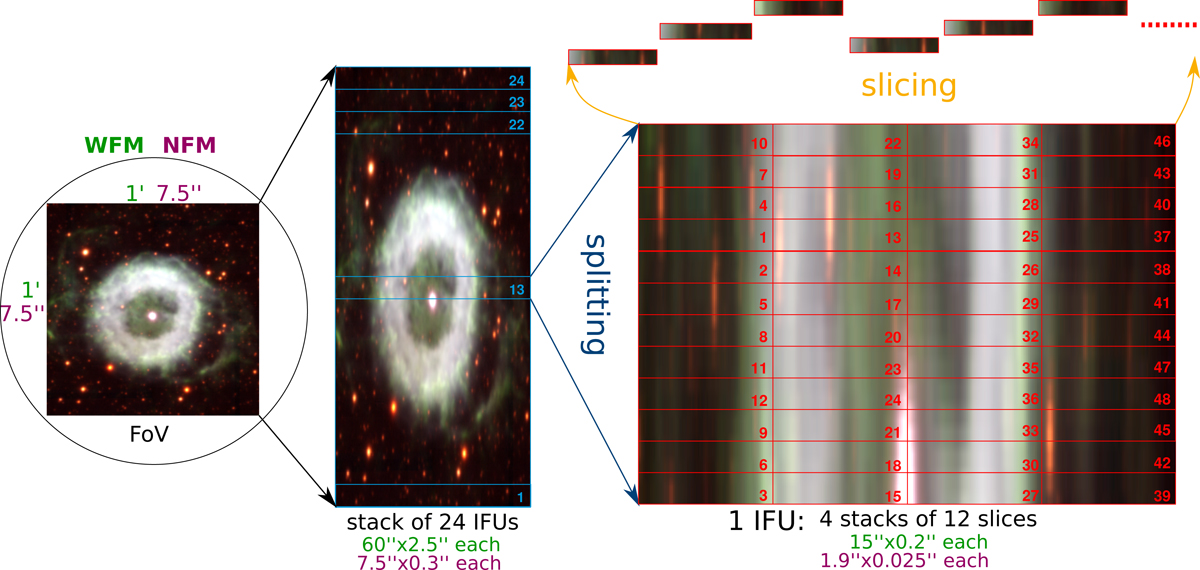
Layout of the MUSE instrument, from the focal plane of the VLT (left) to the individual slices (top right). The light from the slices is subsequently dispersed and recorded on the CCD, and there forms the step-pattern visible in Fig. 2. The sizes of the different elements are given as nominal values (green: for WFM, violet: for NFM), the actual sizes are slightly different and change across the field. Overlaid on the images are the channel numbers (on the IFU stack) and the numbers of the slices as counted left to right on the raw data images (on the slicer stack). The example image is a color picture of the planetary nebula NGC 6369, as observed with MUSE in WFM-AO-N on 15 July 2017.
Current usage metrics show cumulative count of Article Views (full-text article views including HTML views, PDF and ePub downloads, according to the available data) and Abstracts Views on Vision4Press platform.
Data correspond to usage on the plateform after 2015. The current usage metrics is available 48-96 hours after online publication and is updated daily on week days.
Initial download of the metrics may take a while.