Free Access
Fig. 11.
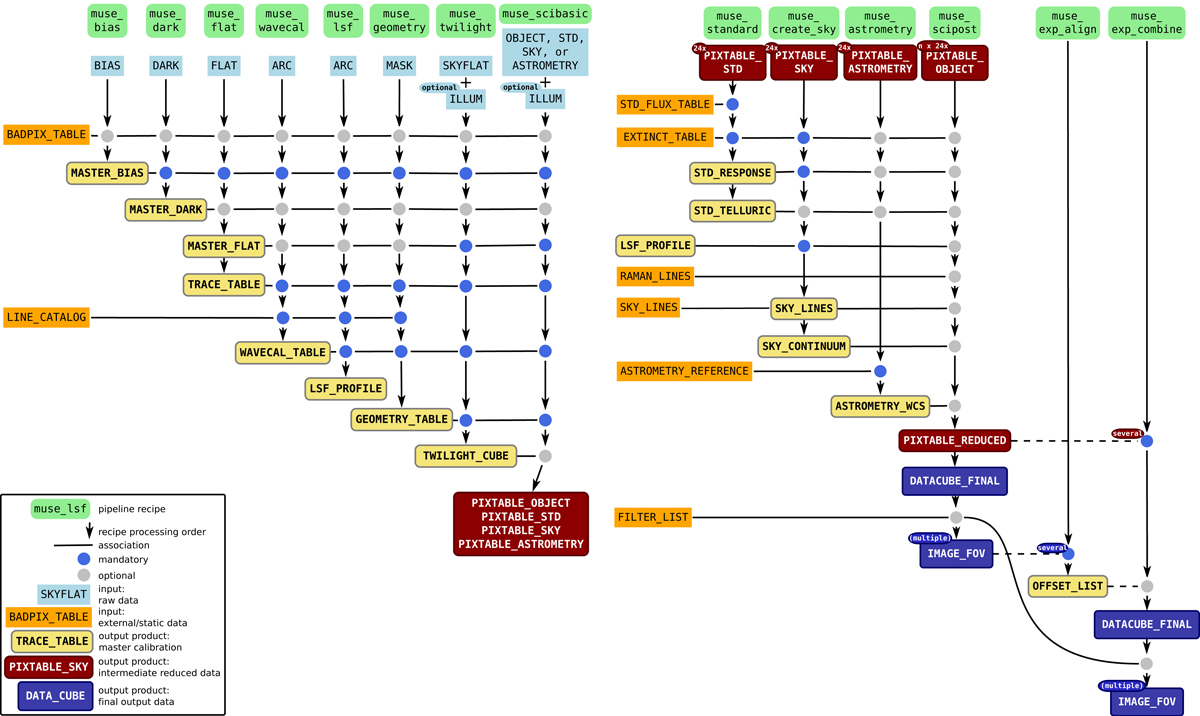
Left: basic processing recipes and products of the MUSE pipeline. Right: post-processing steps in the MUSE pipeline. Compared to Fig. 1 this shows all input and output files and includes all calibration modules.
Current usage metrics show cumulative count of Article Views (full-text article views including HTML views, PDF and ePub downloads, according to the available data) and Abstracts Views on Vision4Press platform.
Data correspond to usage on the plateform after 2015. The current usage metrics is available 48-96 hours after online publication and is updated daily on week days.
Initial download of the metrics may take a while.