Fig. 1.
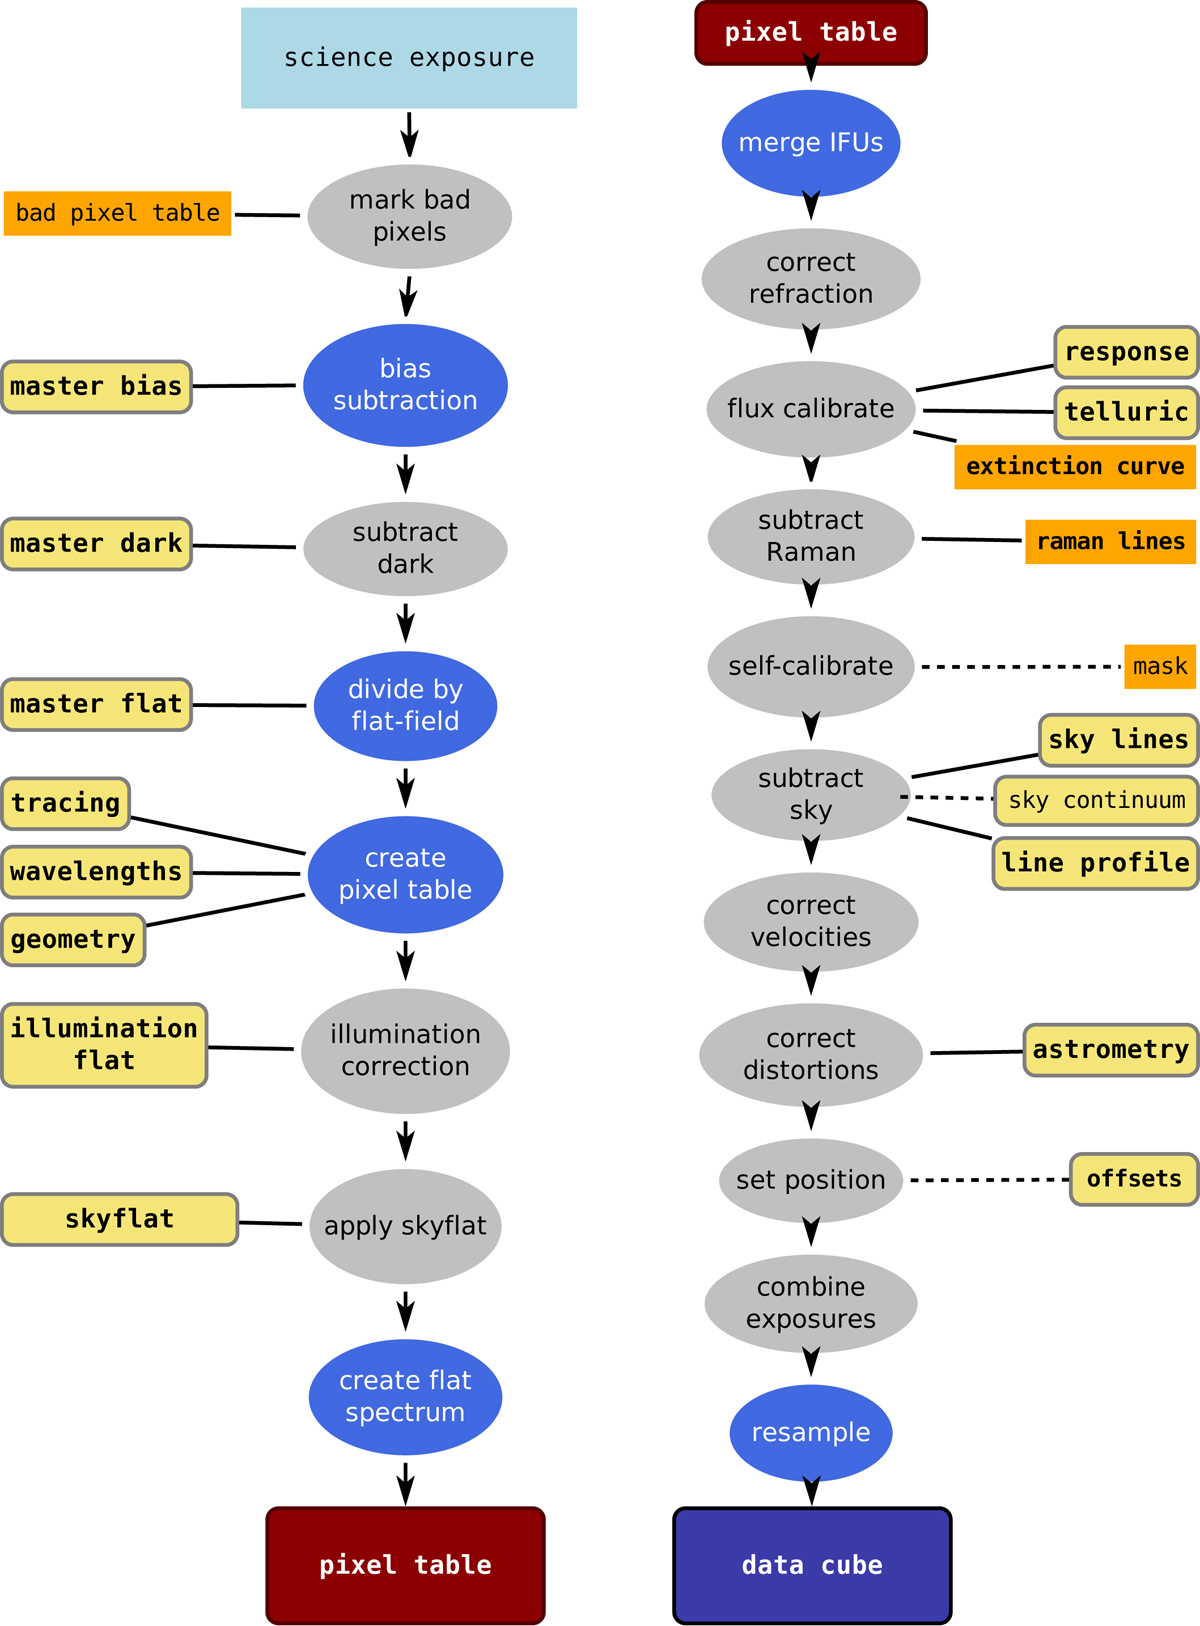
Left: basic processing from raw science data to the intermediate pixel table. Right: post-processing from pixel table to the final datacube. Optional steps are in gray, mandatory ones in blue. Manually created input files have an orange background; calibrations are highlighted in yellow. Inputs that are needed are connected with a solid line; dotted lines signify inputs that are not required.
Current usage metrics show cumulative count of Article Views (full-text article views including HTML views, PDF and ePub downloads, according to the available data) and Abstracts Views on Vision4Press platform.
Data correspond to usage on the plateform after 2015. The current usage metrics is available 48-96 hours after online publication and is updated daily on week days.
Initial download of the metrics may take a while.