Fig. 5.
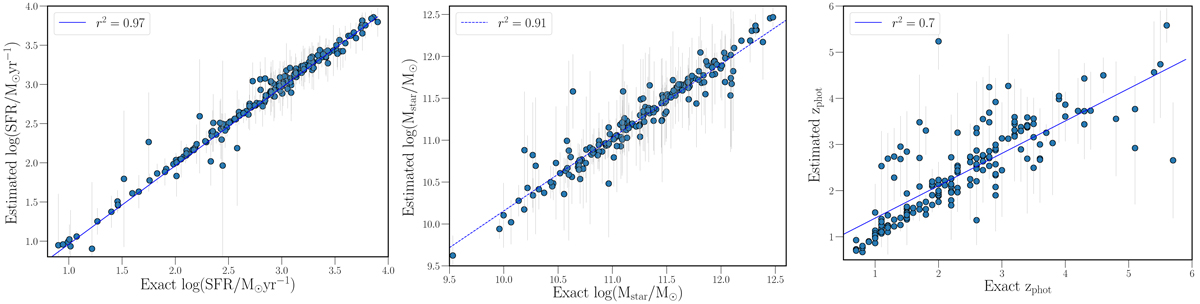
Quality analysis was produced with the mock photometry to calculate exact values for selected physical parameters: the star formation rate, the stellar mass and the photometric redshift. The x-axis represents the exact parameter calculated from the mock photometry from the best fit, the y-axis represents the estimated value presented in the results. The blue line is the regression line with the correlation coefficient shown in the top-left of each panel. The good agreement between the two values implies a good reproducibility for the SFR, stellar masses and photometric redshifts.
Current usage metrics show cumulative count of Article Views (full-text article views including HTML views, PDF and ePub downloads, according to the available data) and Abstracts Views on Vision4Press platform.
Data correspond to usage on the plateform after 2015. The current usage metrics is available 48-96 hours after online publication and is updated daily on week days.
Initial download of the metrics may take a while.