Fig. 4.
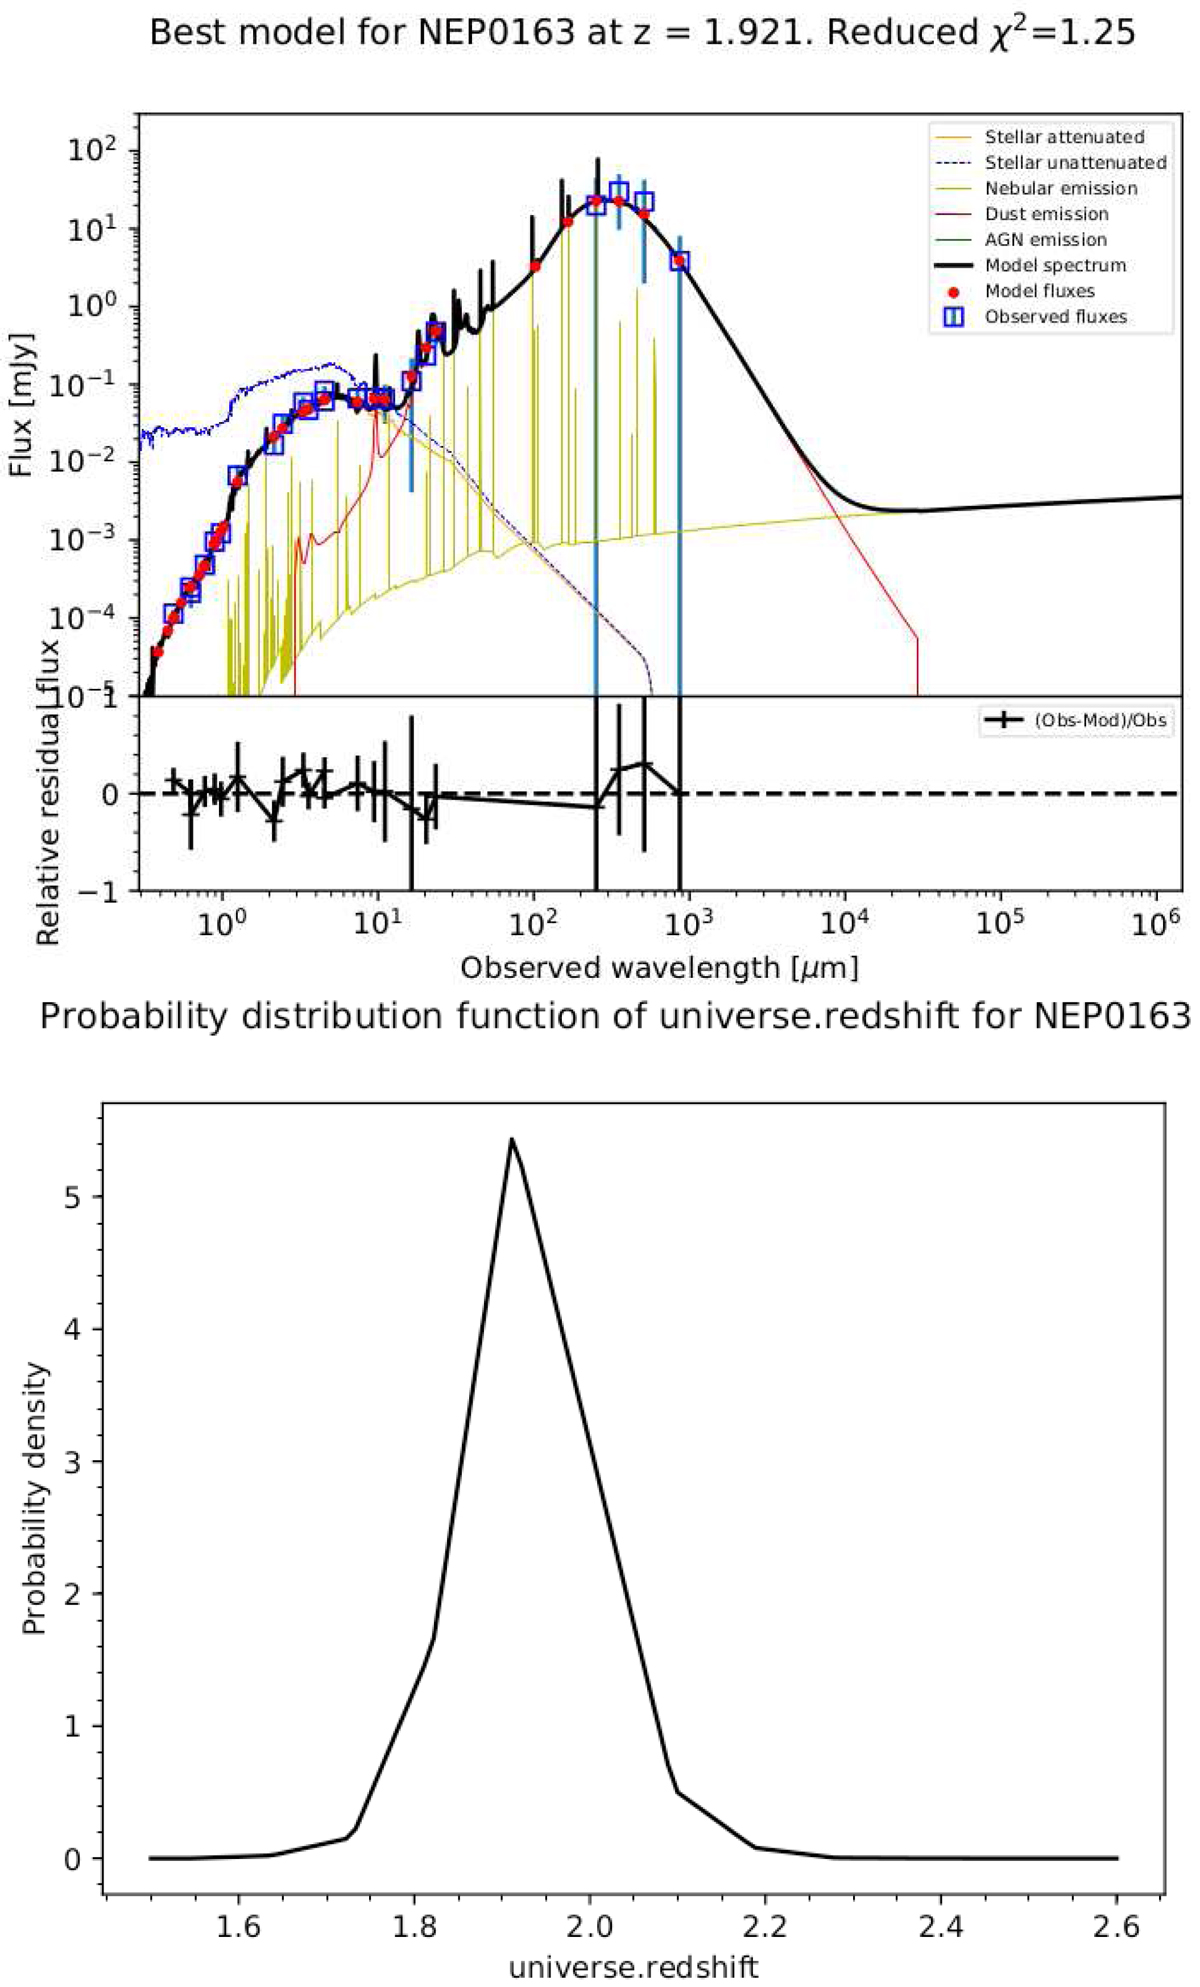
Left panel: example galaxy SED fit from our sample produced by CIGALE with the modules taken into account in the legend. The blue squares are the observed fluxes in mJy, the red dots represent the corresponding predicted fluxes by CIGALE that lie on the black line model fit. Bruzual & Charlot (2003) reproduces the stellar component, where the orange line is the stellar attenuation whereas the blue line shows the unattenuated stellar emission. The green line is the AGN component, modelled by the Fritz et al. (2006) (no green line implies no AGN presence). The dust component is represented by the red line (Draine et al. 2014). The emission lines are shown in pale yellow. The upper part of the plot shows the ID of the source, the redshift and the reduced χ2 fit result. Right panel: corresponding probability distribution function (PDF) of the estimated photometric redshift for the source in the left panel. The PDF peaks at redshift zphot = 1.9. CIGALE produces a Bayesian analysis for each parameter selecting the most likely result.
Current usage metrics show cumulative count of Article Views (full-text article views including HTML views, PDF and ePub downloads, according to the available data) and Abstracts Views on Vision4Press platform.
Data correspond to usage on the plateform after 2015. The current usage metrics is available 48-96 hours after online publication and is updated daily on week days.
Initial download of the metrics may take a while.