Fig. 2.
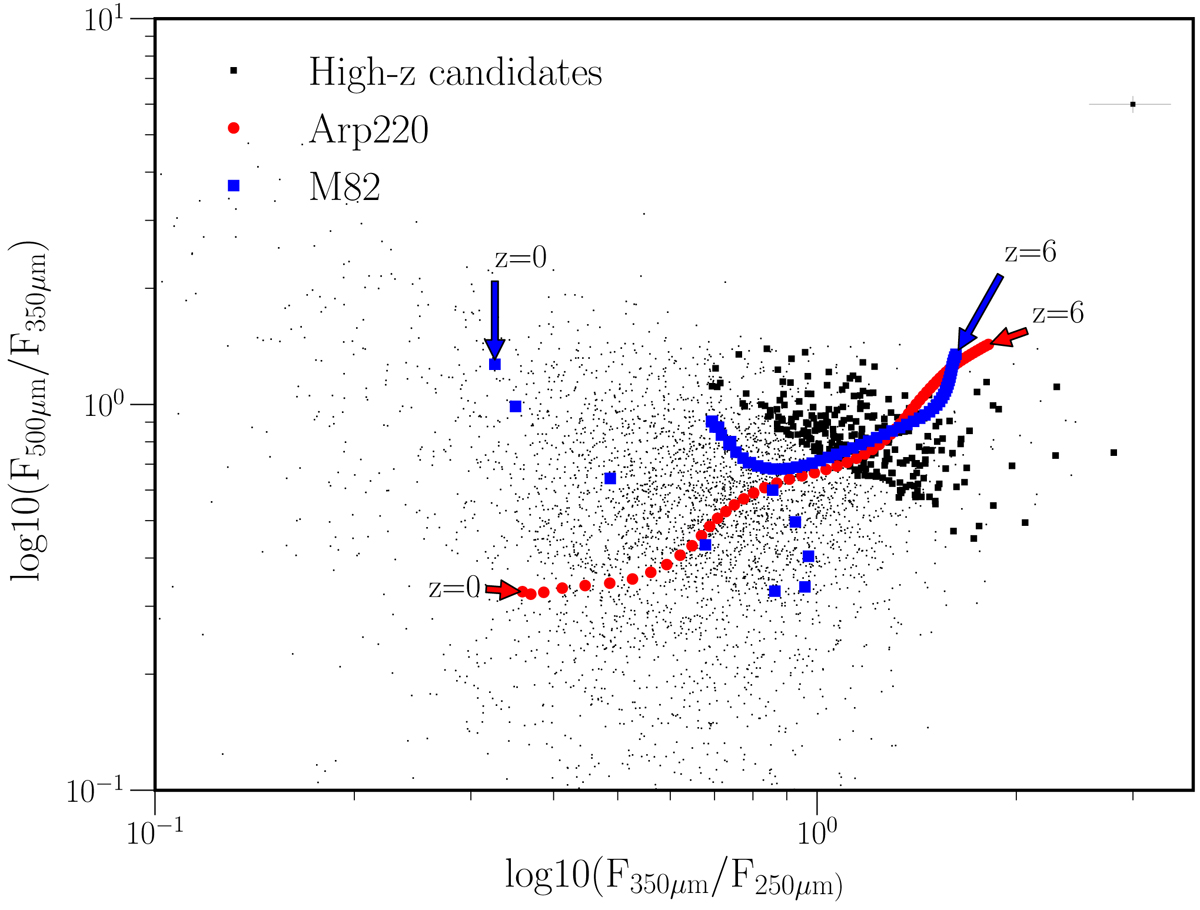
Colour–colour diagram of the SPIRE fluxes with the tracks of the local starburst galaxies M82 (blue) and Arp220 (red) over-plotted. The tracks represent the observed colours as expected from the same SEDs observed at different redshifts from z = 0 to z = 6 with redshift steps of Δz = 0.1 The bold points are the high-z candidates which lie in the same colour space than the evolved tracks at z > 2. The upper right area of the plot shows the average error bar for the high-z candidates. all these methods are based on MBB models, where the redshift evolution of the SEDs is not included. Therefore, more sophisticated SED templates should be used to investigate the correlation between redshift and colours.
Current usage metrics show cumulative count of Article Views (full-text article views including HTML views, PDF and ePub downloads, according to the available data) and Abstracts Views on Vision4Press platform.
Data correspond to usage on the plateform after 2015. The current usage metrics is available 48-96 hours after online publication and is updated daily on week days.
Initial download of the metrics may take a while.