Fig. 1.
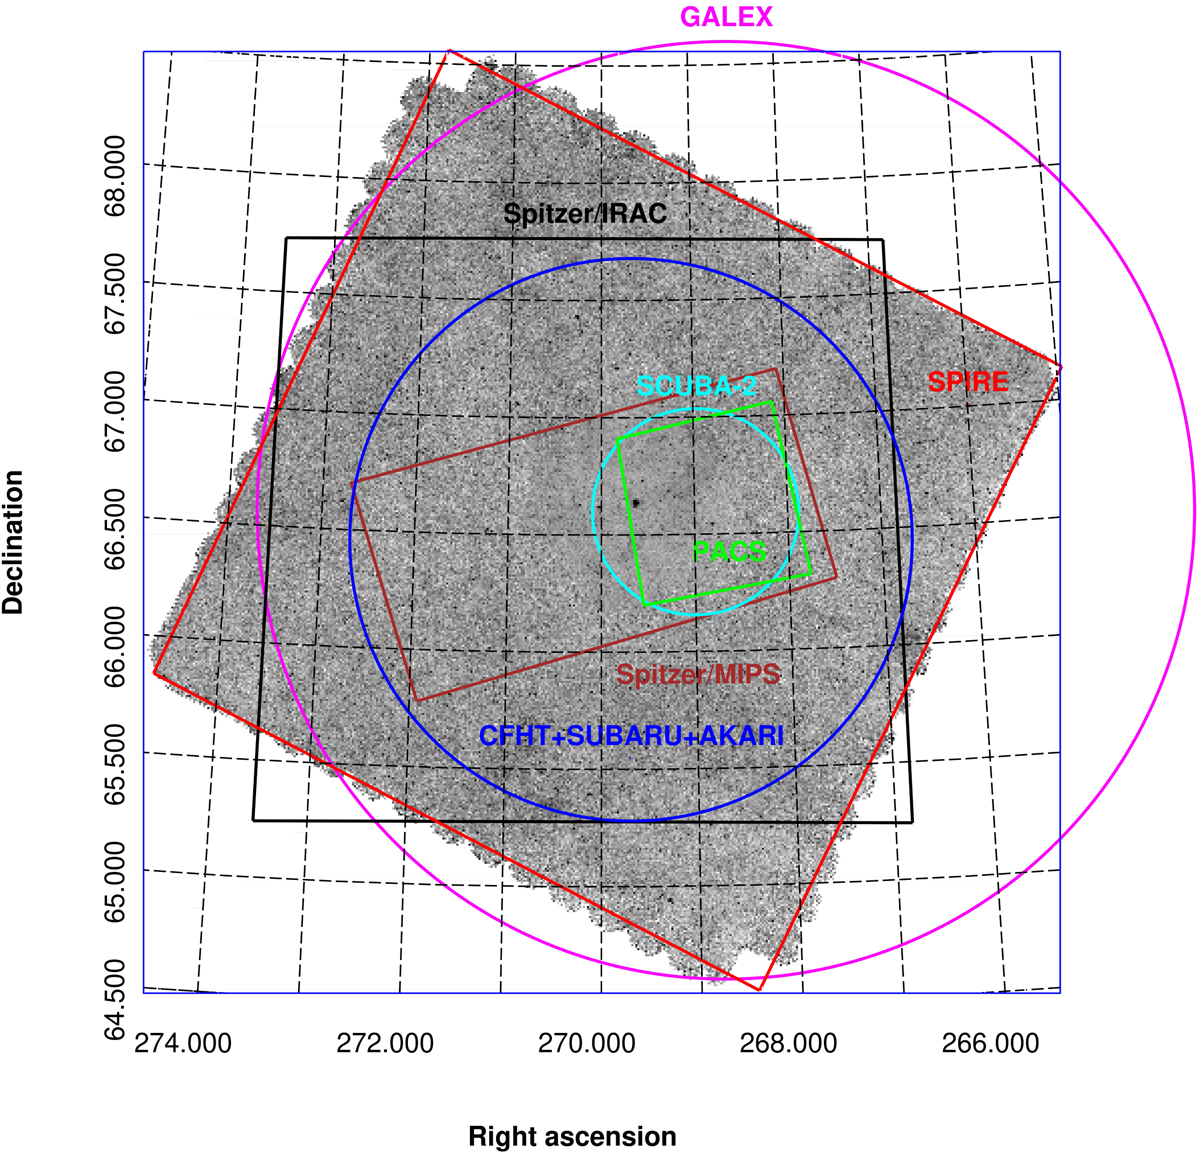
Primary surveys located over the NEP field are used in this study. In the inner regions, the cyan circle and the green rectangle represent the SCUBA-2 (Geach et al. 2017) and the PACS (Pearson et al. 2019) observations respectively. The inner dark red rectangle shows the region of the Spitzer/MIPS data, which has no homogeneous borders. The big blue circle represents the area covered by AKARI, CFHT (Kim et al. 2012; Murata et al. 2013) and SUBARU (Oi et al., in prep.) observations. The red square corresponds to the area covered by the SPIRE (Herschel) observations (Pearson et al. 2017, and in prep.). The big magenta circle shows the coverage of GALEX data (Bianchi 2014).
Current usage metrics show cumulative count of Article Views (full-text article views including HTML views, PDF and ePub downloads, according to the available data) and Abstracts Views on Vision4Press platform.
Data correspond to usage on the plateform after 2015. The current usage metrics is available 48-96 hours after online publication and is updated daily on week days.
Initial download of the metrics may take a while.