Free Access
Fig. 4
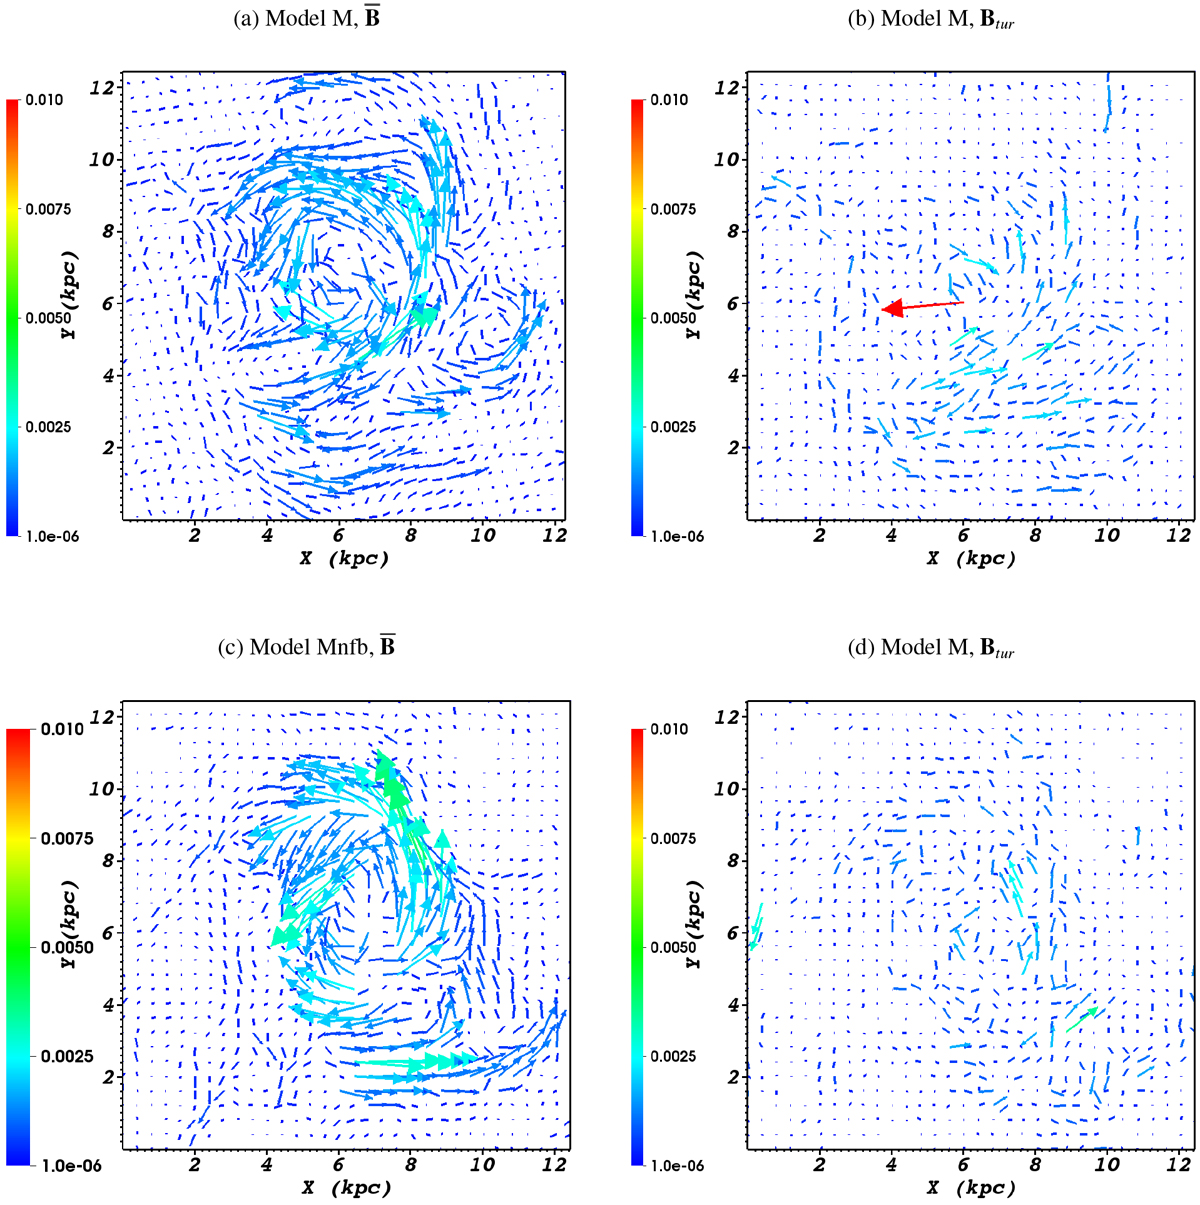
Mean (panels a and c) and turbulent (panels b and d) components of the magnetic field in Models M (panels a and b) and Mnfb (panels c and d), shown in a slice along the midplane of the galaxies, at 1275 Myr into their evolution. The colors indicate the magnitude of the vectors drawn in each plot, in μG.
Current usage metrics show cumulative count of Article Views (full-text article views including HTML views, PDF and ePub downloads, according to the available data) and Abstracts Views on Vision4Press platform.
Data correspond to usage on the plateform after 2015. The current usage metrics is available 48-96 hours after online publication and is updated daily on week days.
Initial download of the metrics may take a while.