Fig. 7.
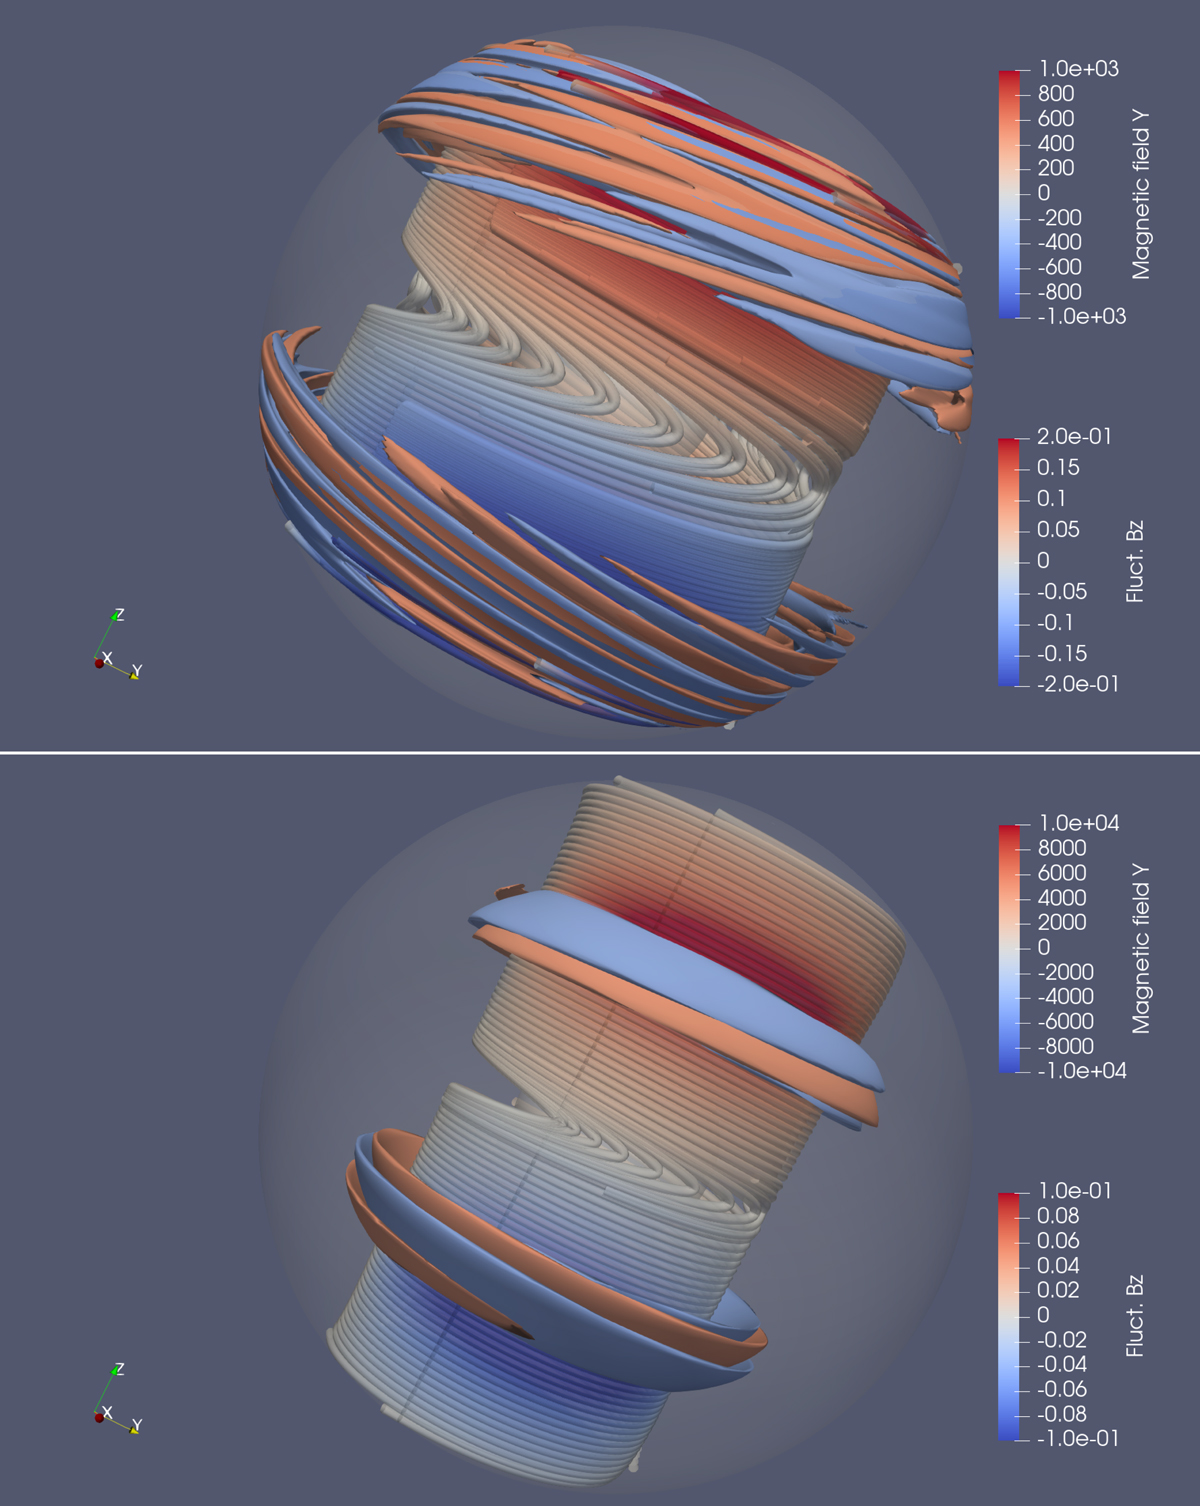
3D views of the instability in the two cases: Case C2 on top and case R2 below. The magnetic field lines of the background axisymmetric magnetic field are plotted around the location of the instability and colored with the values of the toroidal magnetic field (in the Y-direction in the Cartesian frame shown at the bottom left) and isosurfaces of the axial component of the fluctuating magnetic field are overplotted.
Current usage metrics show cumulative count of Article Views (full-text article views including HTML views, PDF and ePub downloads, according to the available data) and Abstracts Views on Vision4Press platform.
Data correspond to usage on the plateform after 2015. The current usage metrics is available 48-96 hours after online publication and is updated daily on week days.
Initial download of the metrics may take a while.