Open Access
Fig. 5.
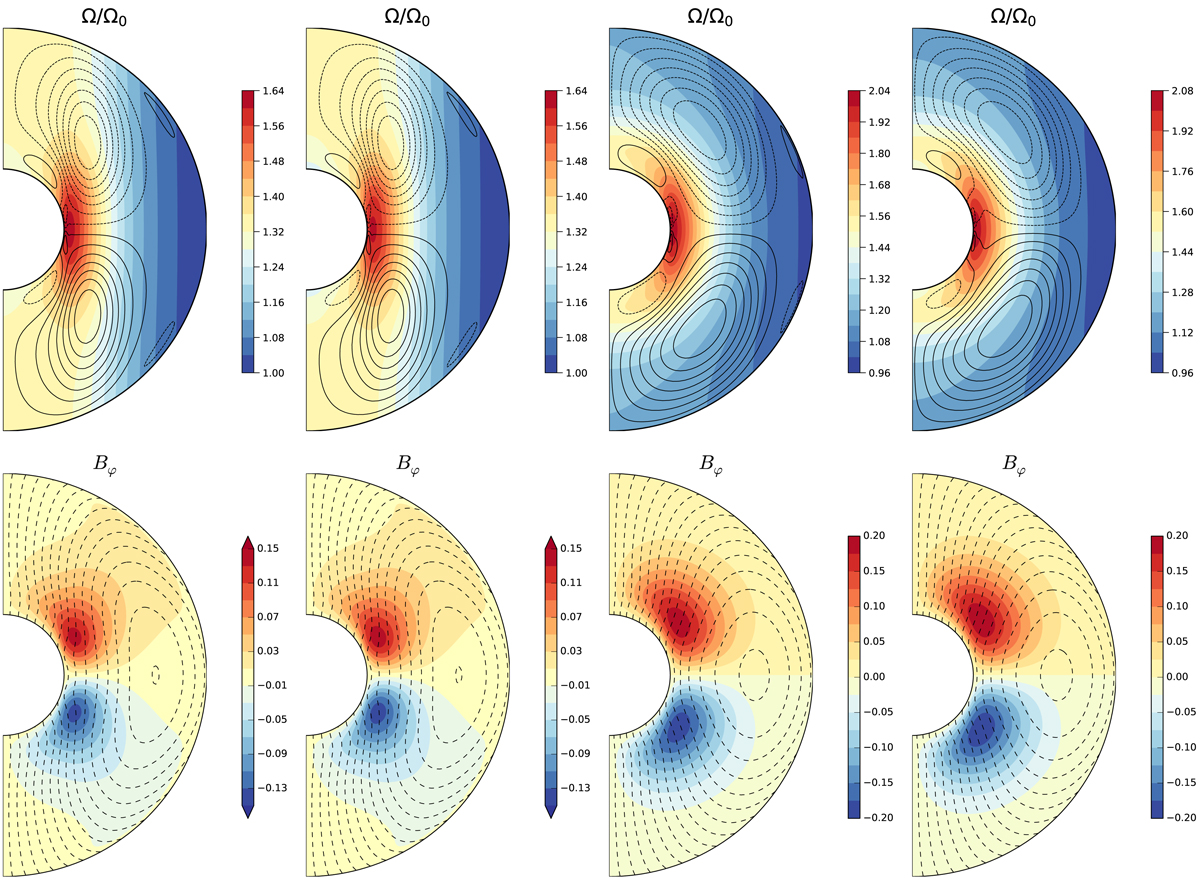
Structure of the flow (top panels: rotation rate in color, meridional flow contours in black lines) and of the magnetic field (bottom panels: toroidal field in color and poloidal field lines in dashed lines) at time t = 0.1tap, for R7 and R8 (two left panels) and for R2 and R6 (two right panels).
Current usage metrics show cumulative count of Article Views (full-text article views including HTML views, PDF and ePub downloads, according to the available data) and Abstracts Views on Vision4Press platform.
Data correspond to usage on the plateform after 2015. The current usage metrics is available 48-96 hours after online publication and is updated daily on week days.
Initial download of the metrics may take a while.