Fig. 4.
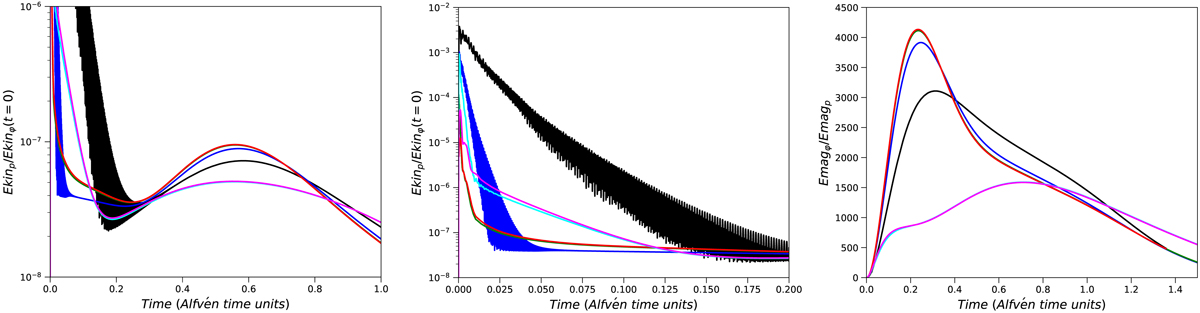
Temporal evolution of the kinetic energy (on a long timescale, left and zoomed in, mid-panel) and magnetic energy ratio (right) for five different cases: three cases with ![]() (blue: R2, green: R5, red: R6 and black: R9) and two cases with
(blue: R2, green: R5, red: R6 and black: R9) and two cases with ![]() (cyan: R7 and magenta: R8). For the magnetic energy plot, the cyan and magenta curves are almost superimposed, as well as the red and green curves. The long term evolution is similar for the cases with the same
(cyan: R7 and magenta: R8). For the magnetic energy plot, the cyan and magenta curves are almost superimposed, as well as the red and green curves. The long term evolution is similar for the cases with the same ![]() , as long as Pr is small enough, but different for different values of
, as long as Pr is small enough, but different for different values of ![]() . In particular, the amount of toroidal field produced is much less in the case where
. In particular, the amount of toroidal field produced is much less in the case where ![]() .
.
Current usage metrics show cumulative count of Article Views (full-text article views including HTML views, PDF and ePub downloads, according to the available data) and Abstracts Views on Vision4Press platform.
Data correspond to usage on the plateform after 2015. The current usage metrics is available 48-96 hours after online publication and is updated daily on week days.
Initial download of the metrics may take a while.