Fig. 12.
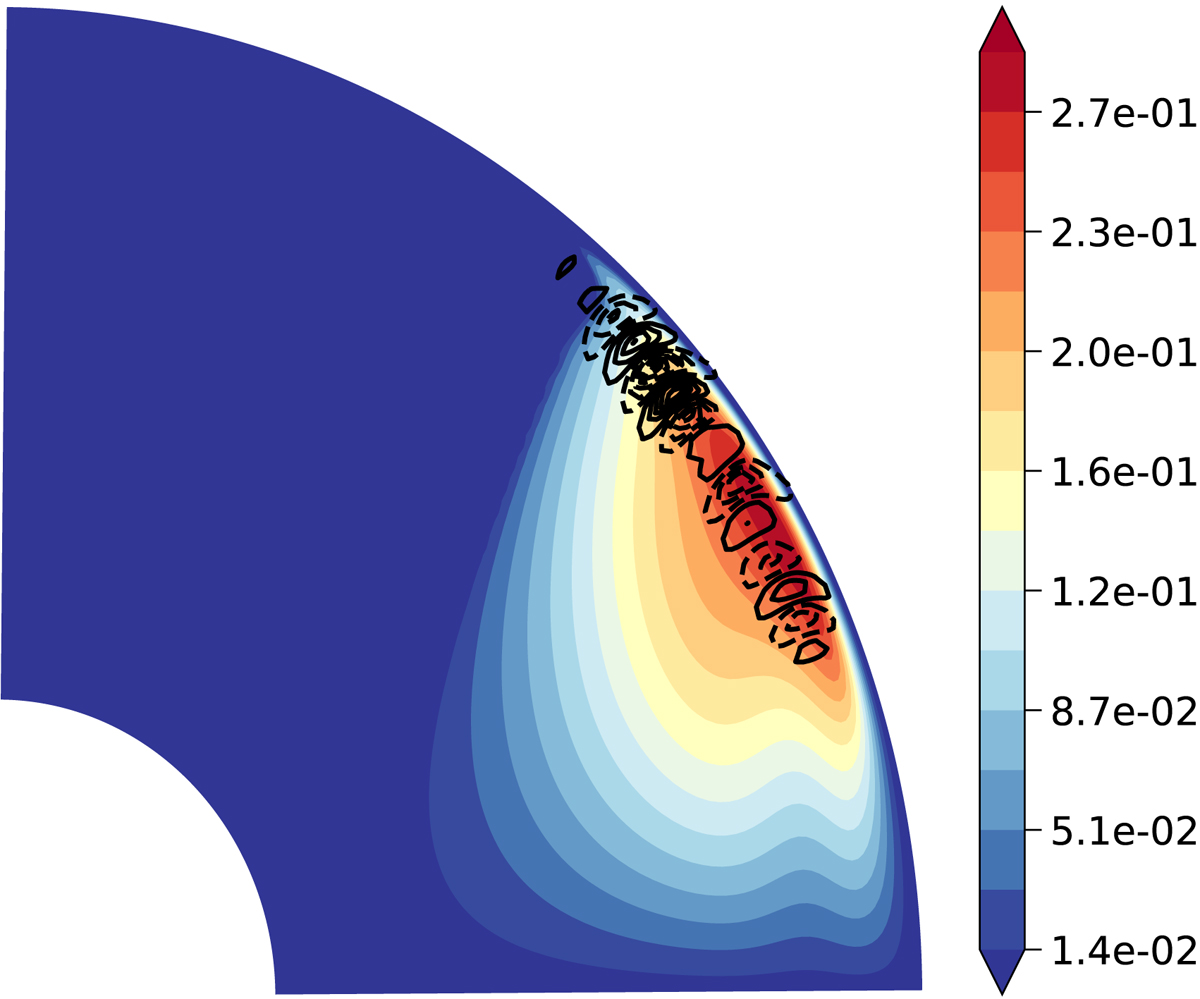
Same as Fig. 10 but for Case C2 and for the m = 4 mode. Again, the location of the instability in the simulation corresponds quite well with the position of the expected maximum growth rate from the local analysis. Case C3 is not shown since the local analysis does not predict any instability in this case, in agreement with the 3D simulation.
Current usage metrics show cumulative count of Article Views (full-text article views including HTML views, PDF and ePub downloads, according to the available data) and Abstracts Views on Vision4Press platform.
Data correspond to usage on the plateform after 2015. The current usage metrics is available 48-96 hours after online publication and is updated daily on week days.
Initial download of the metrics may take a while.