Fig. 10.
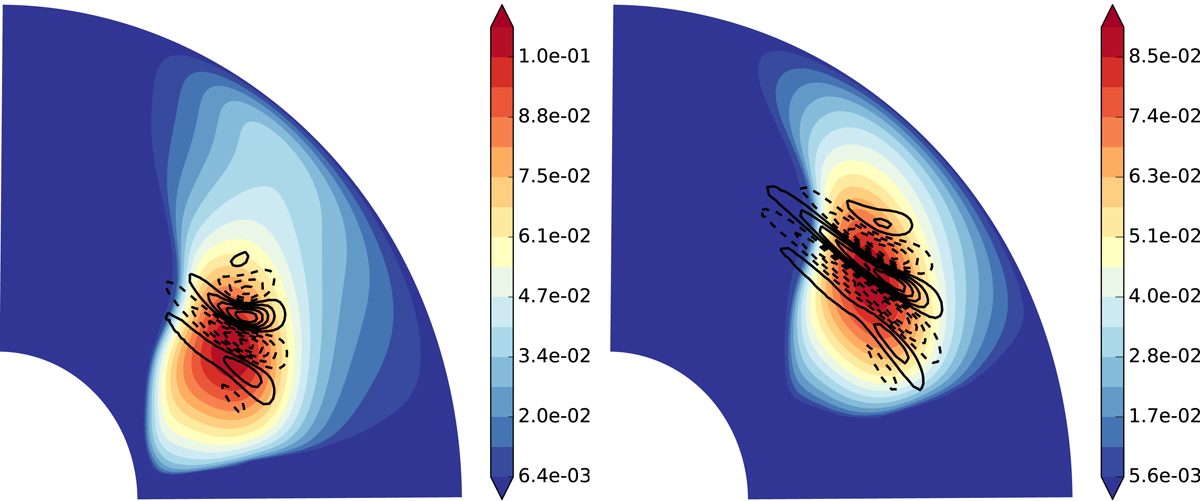
Cases R2 (left) and R3 (right): contours of the growth rate σ/Ω0 of the m = 1 mode obtained through the Acheson dispersion relation (colors) and superimposed in black lines are the contours of the fluctuating radial magnetic field coming from the 3D simulation. The agreement for the location of the instability is quite satisfactory in both cases.
Current usage metrics show cumulative count of Article Views (full-text article views including HTML views, PDF and ePub downloads, according to the available data) and Abstracts Views on Vision4Press platform.
Data correspond to usage on the plateform after 2015. The current usage metrics is available 48-96 hours after online publication and is updated daily on week days.
Initial download of the metrics may take a while.