Free Access
Fig. 4
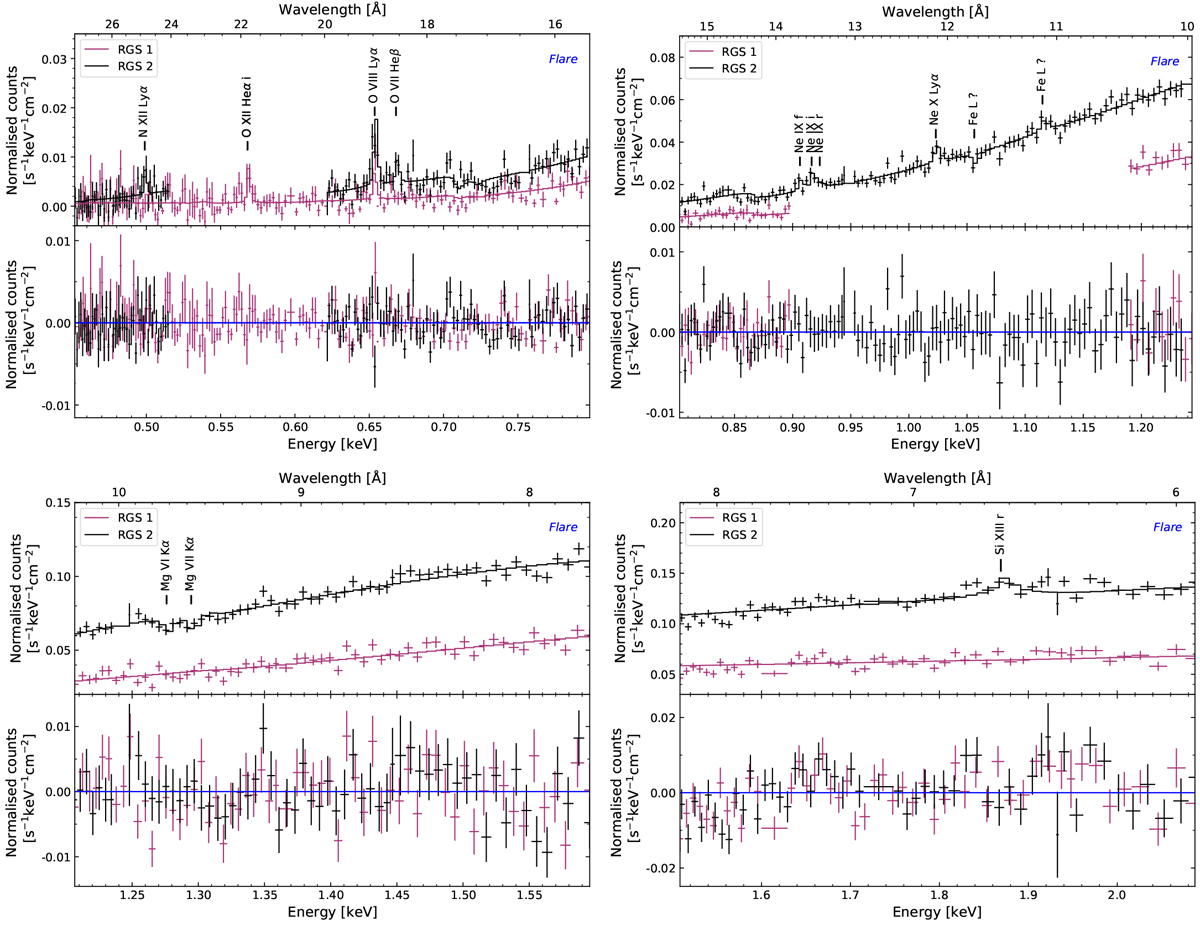
Upper panel: RGS 1 and RGS 2 spectrum of the flare phase in four energy bands (crosses), and best-fit model containing Gaussian components (solid line). Lower panel: residuals in units of data-model. The flux difference between RGS 1 and RGS 2 are attributed to the different coverage of the flare, as shown in Fig. 1.
Current usage metrics show cumulative count of Article Views (full-text article views including HTML views, PDF and ePub downloads, according to the available data) and Abstracts Views on Vision4Press platform.
Data correspond to usage on the plateform after 2015. The current usage metrics is available 48-96 hours after online publication and is updated daily on week days.
Initial download of the metrics may take a while.