Free Access
Fig. 1
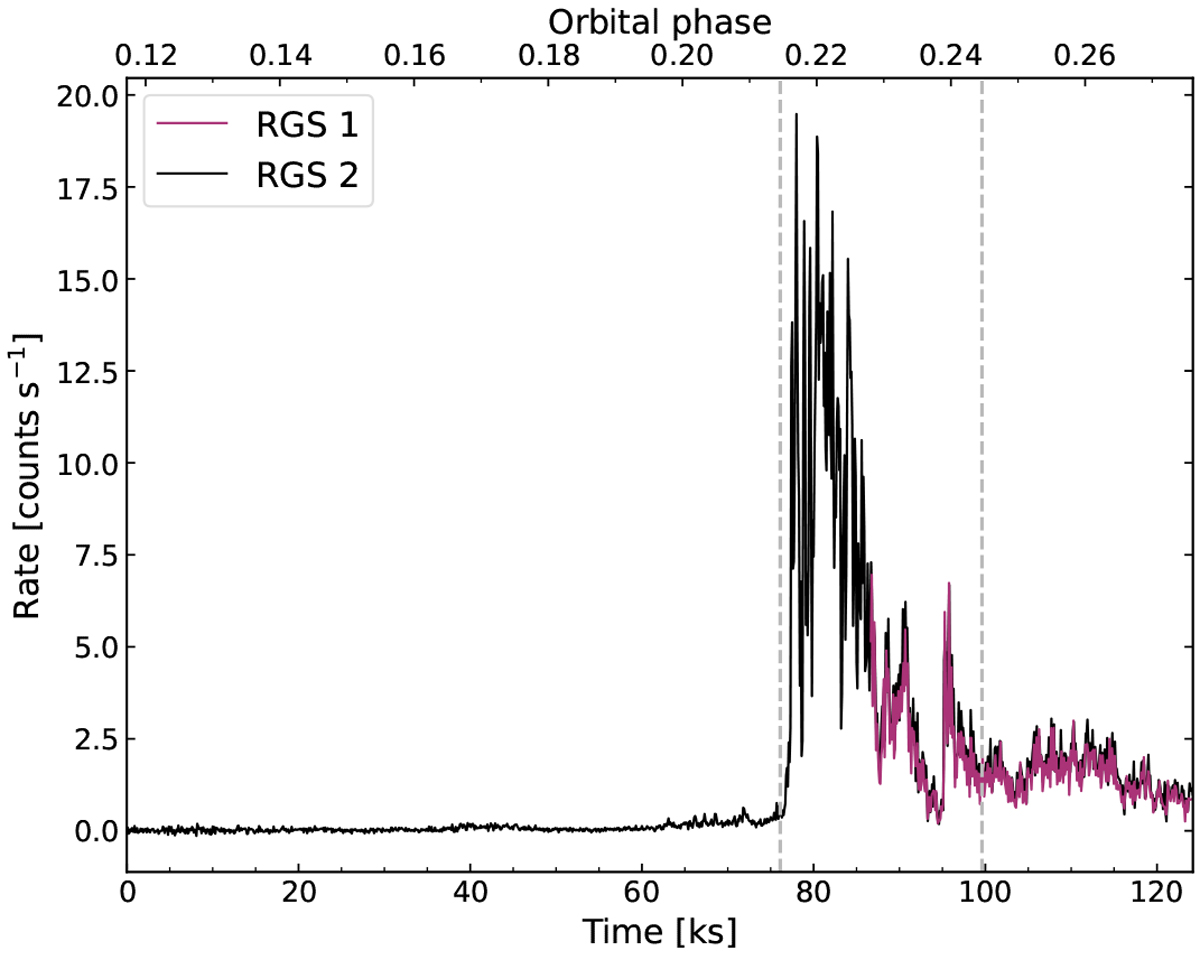
RGS light curves of Vela X-1 during the observation discussed in this paper. Time on the abscissa are from the beginning of the observations (MJD 53 880.439). The dashed lines show thepre-, during and post-flare phases. We use the time of mean longitude of 90 degrees, T90, from Kreykenbohm et al. (2008) as phase zero.
Current usage metrics show cumulative count of Article Views (full-text article views including HTML views, PDF and ePub downloads, according to the available data) and Abstracts Views on Vision4Press platform.
Data correspond to usage on the plateform after 2015. The current usage metrics is available 48-96 hours after online publication and is updated daily on week days.
Initial download of the metrics may take a while.