Fig. 5
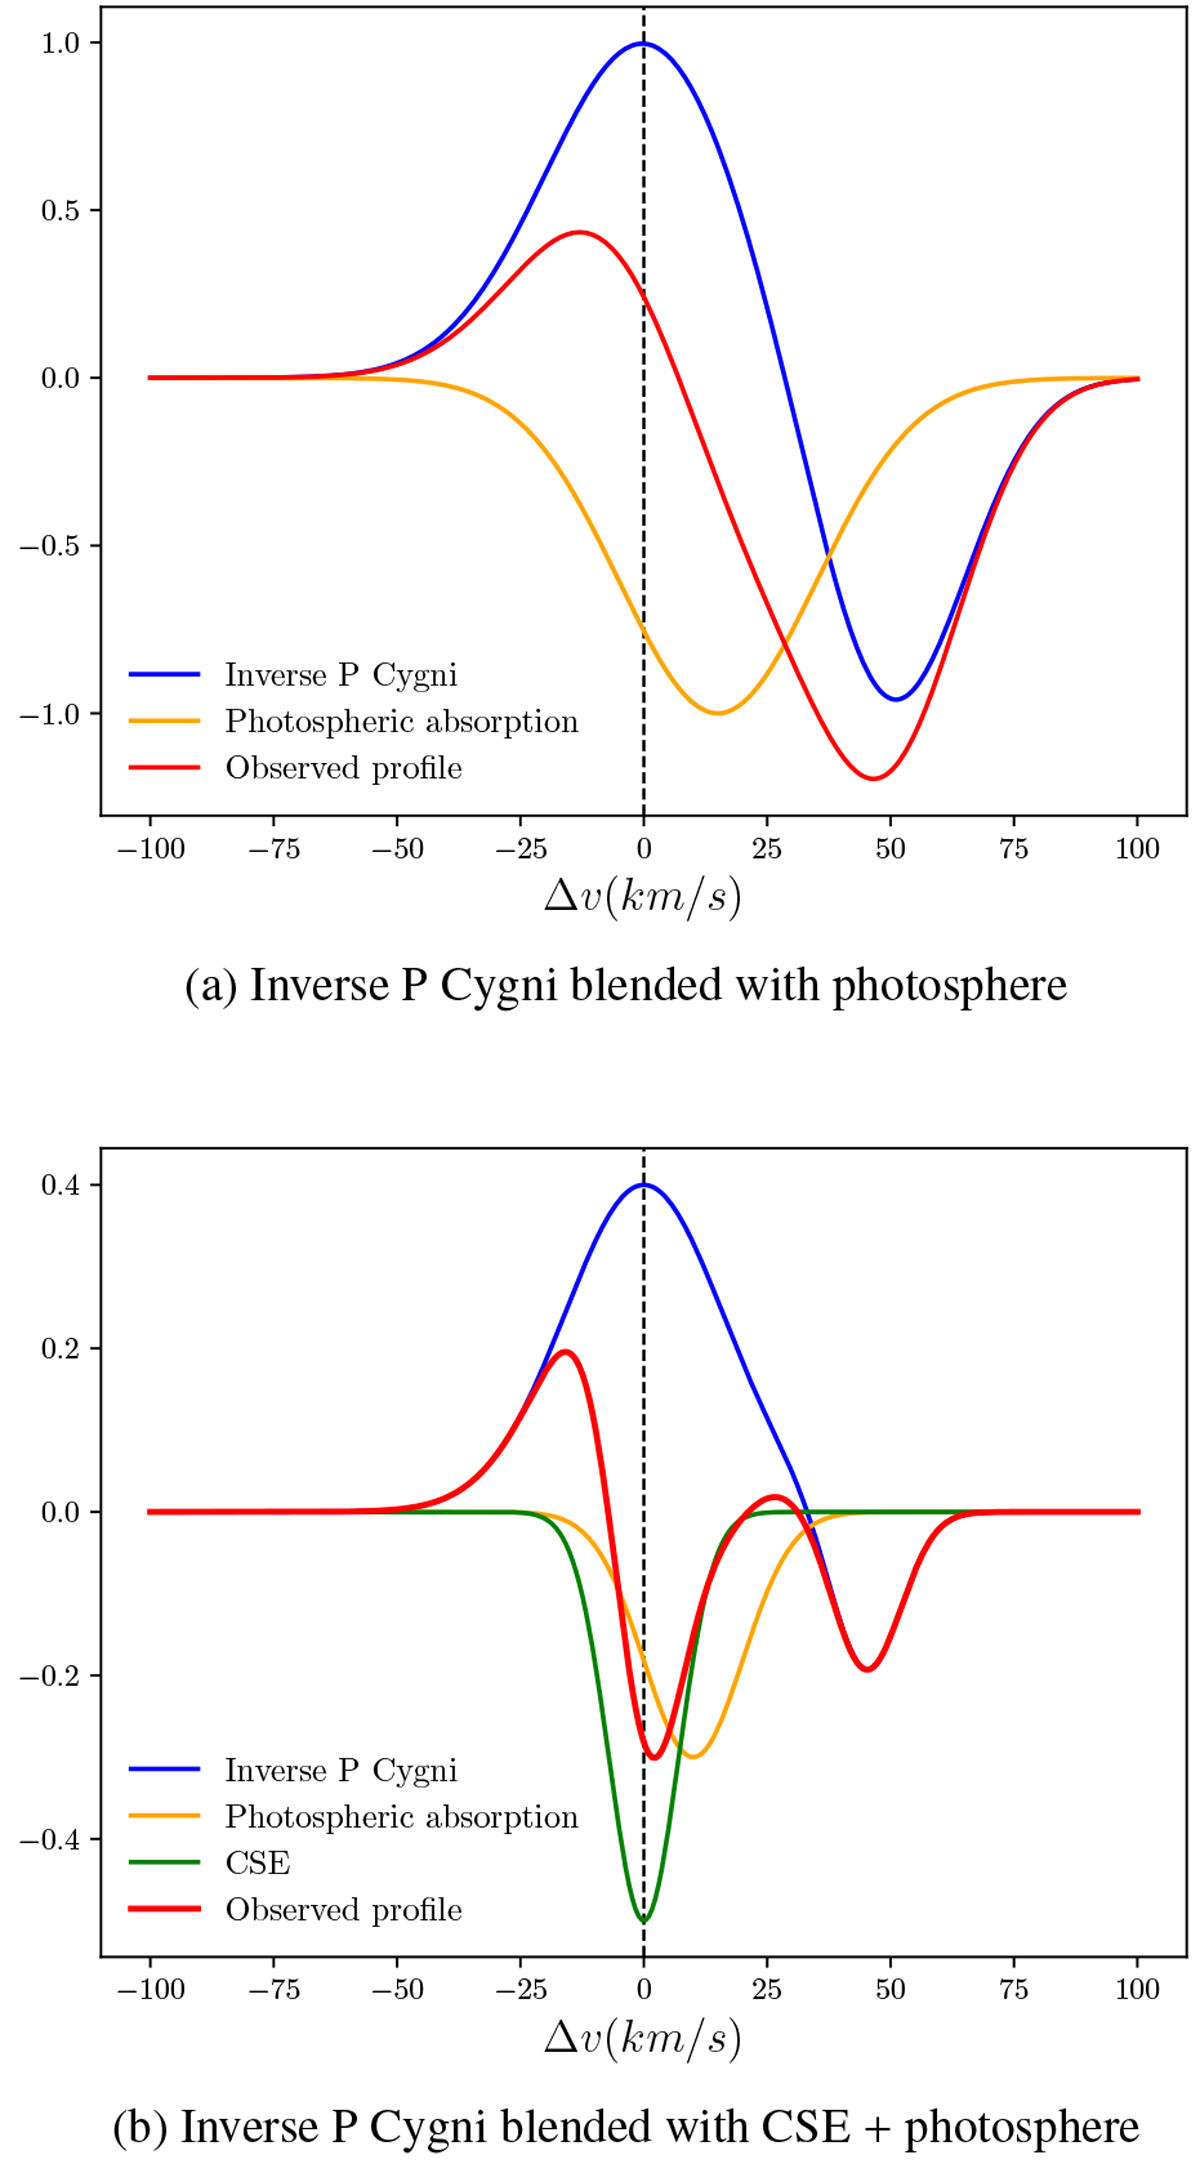
Schematic profile formation of a blended inverse P Cygni profile. Panel a: the supersonic (≈50 km s−1) descending atmospheric layers produce a radiative emission centered on 0 km s−1 (blue curve).This profile is blended with photospheric redshifted (≈15 km s−1) absorption (orange curve) resulting in an apparently weak blueshifted emission. Panel b: in long-period Cepheids, a component centered on 0 km s−1 is attributed to a CSE (green) and causes the appearance of a double absorption profile.
Current usage metrics show cumulative count of Article Views (full-text article views including HTML views, PDF and ePub downloads, according to the available data) and Abstracts Views on Vision4Press platform.
Data correspond to usage on the plateform after 2015. The current usage metrics is available 48-96 hours after online publication and is updated daily on week days.
Initial download of the metrics may take a while.