Fig. 10.
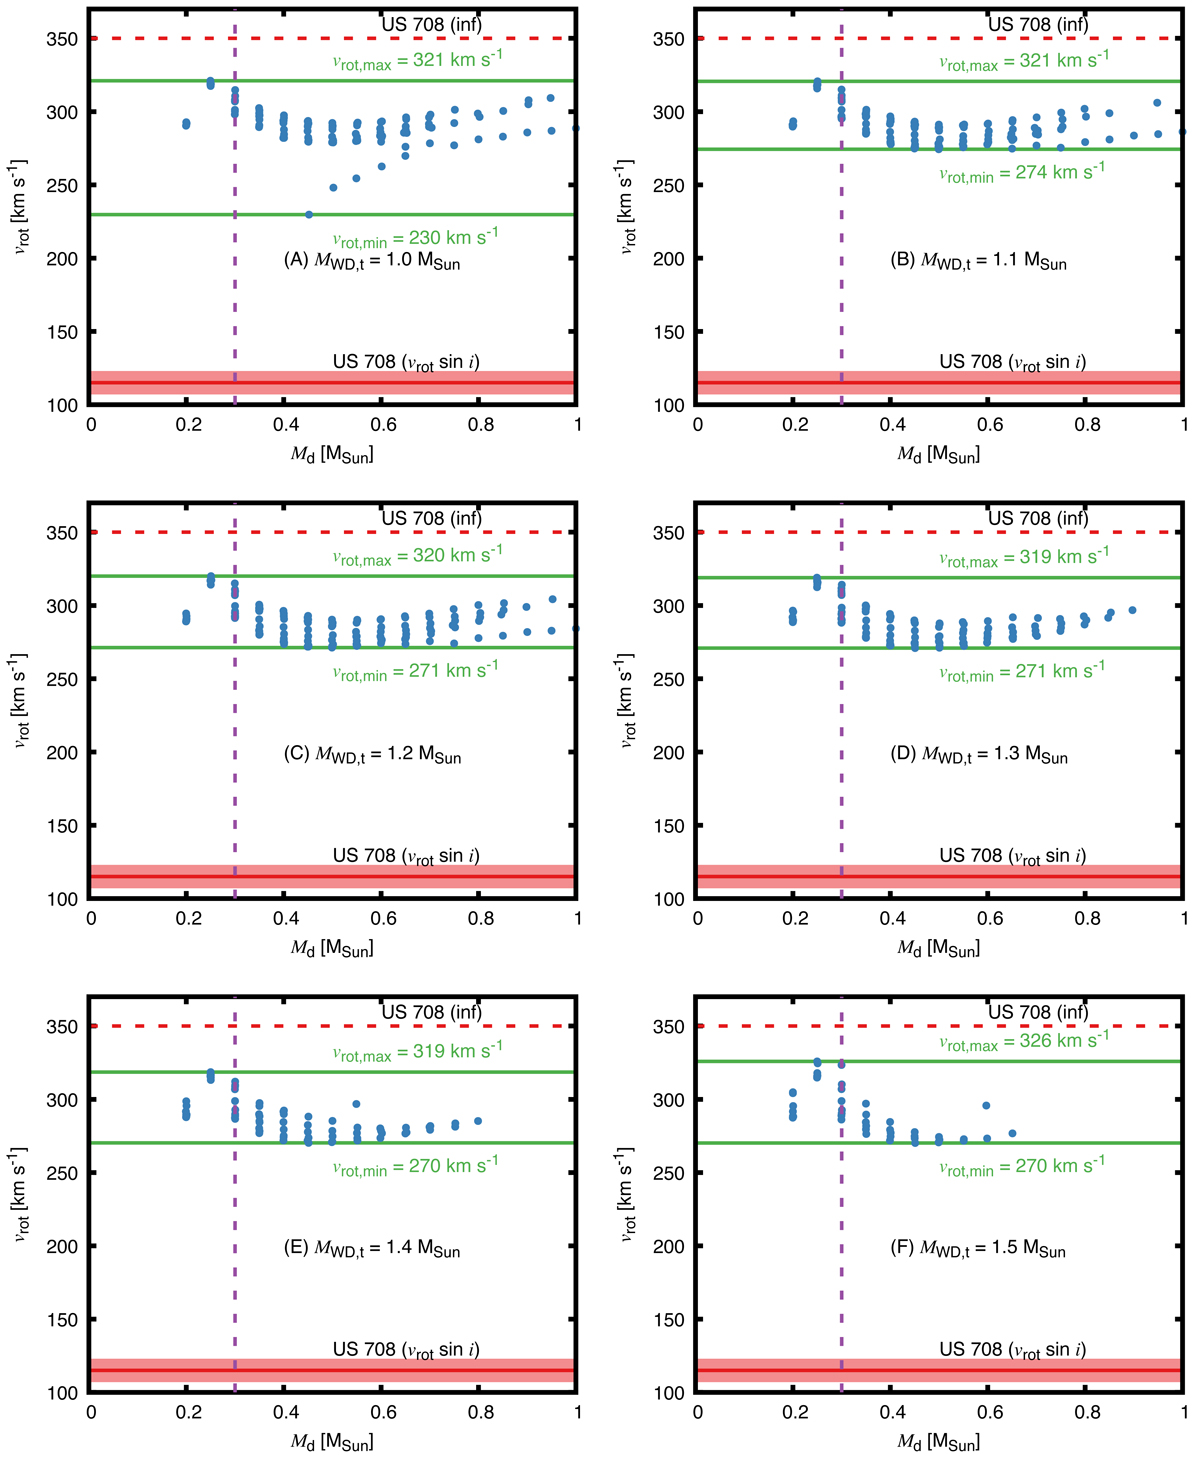
Same as Fig. 8, but showing the ejected companion’s surface rotational velocity at the time of ejection with the observed current vrot sin i, including error bars, given for comparison, with the red dashed line indicates the inferred surface rotational velocity at ejection according to Geier et al. (2015). Green lines indicate the minimum and maximum velocity found in the sample, as labeled.
Current usage metrics show cumulative count of Article Views (full-text article views including HTML views, PDF and ePub downloads, according to the available data) and Abstracts Views on Vision4Press platform.
Data correspond to usage on the plateform after 2015. The current usage metrics is available 48-96 hours after online publication and is updated daily on week days.
Initial download of the metrics may take a while.