Open Access
Fig. 8.
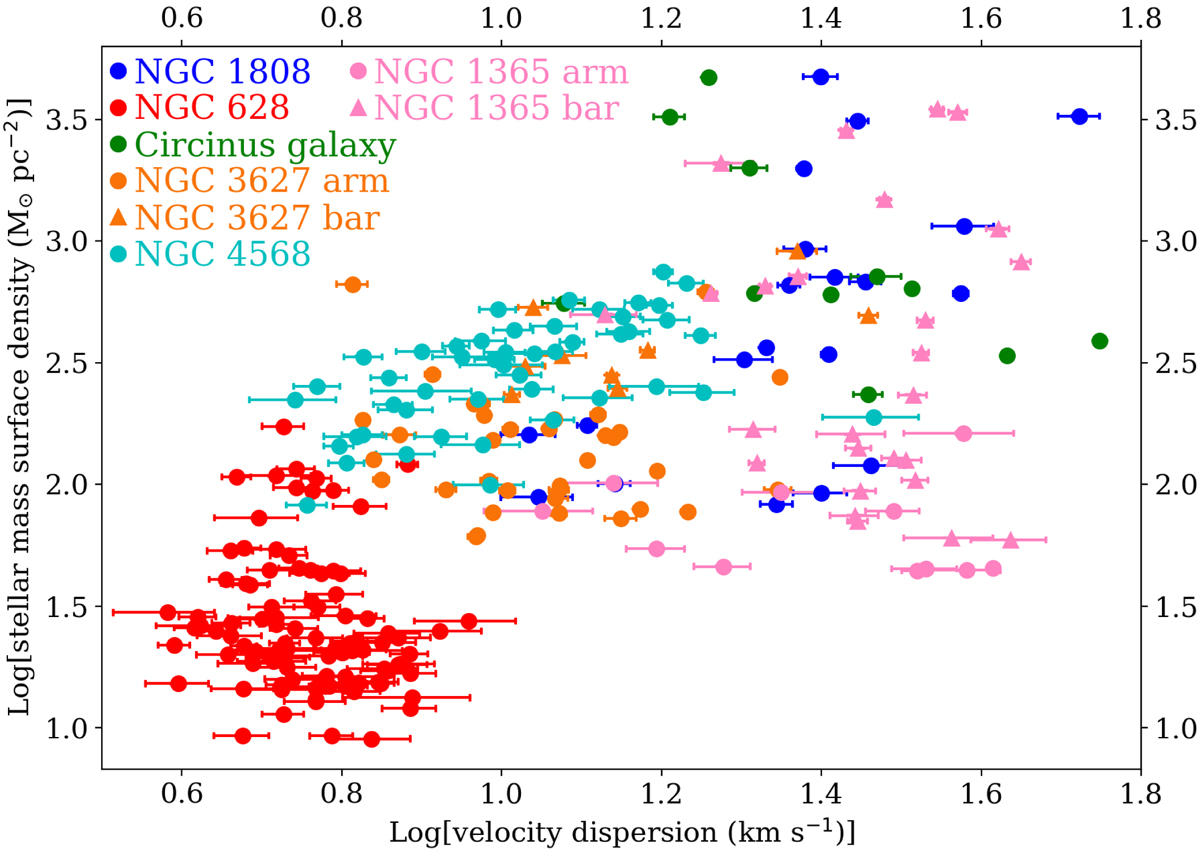
Relation of the velocity dispersion and stellar mass surface density. Different galaxies are marked in different colors as shown in the legend. The solid pink circles of NGC 1365 show the data from the bar region, and the solid pink triangles display the data from the arm region.
Current usage metrics show cumulative count of Article Views (full-text article views including HTML views, PDF and ePub downloads, according to the available data) and Abstracts Views on Vision4Press platform.
Data correspond to usage on the plateform after 2015. The current usage metrics is available 48-96 hours after online publication and is updated daily on week days.
Initial download of the metrics may take a while.