Fig. 7.
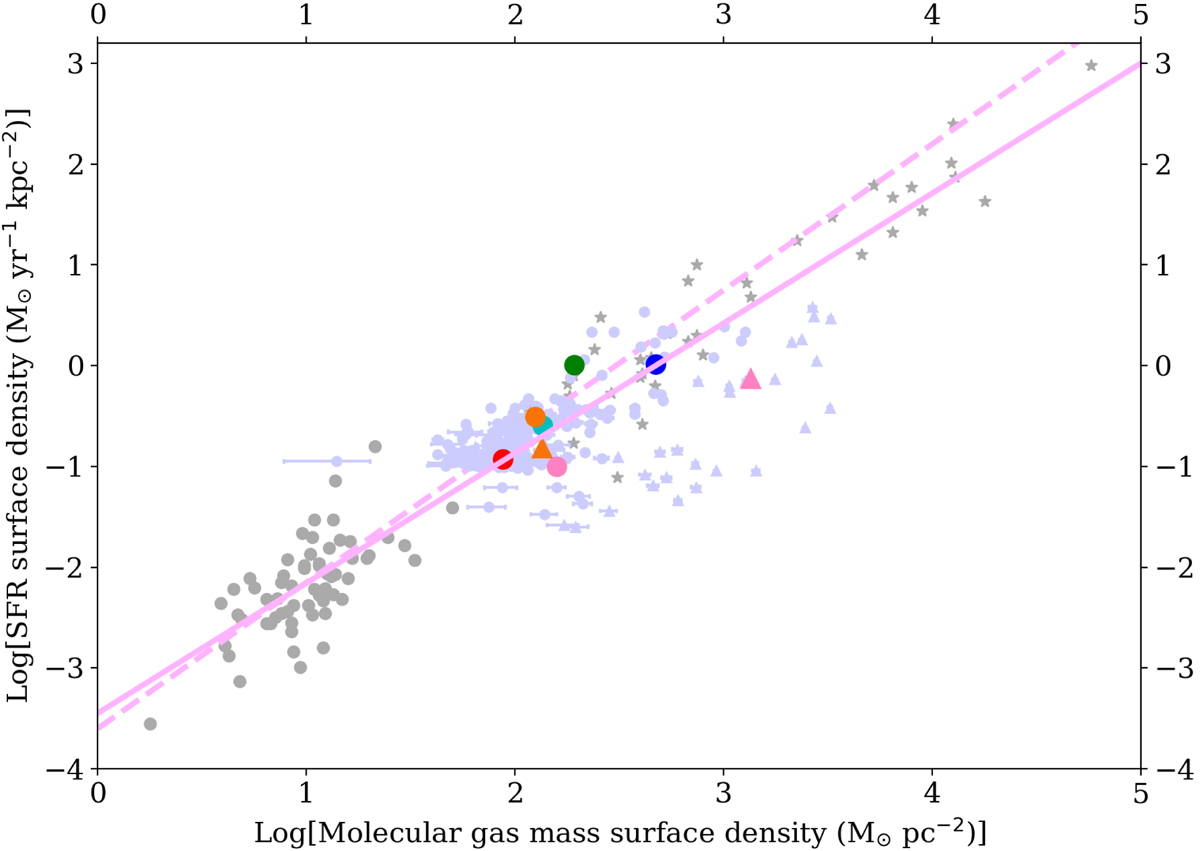
Relation of the gas mass surface density and the SFR surface density. We combined our data with the results of Kennicutt (1998). The gray points represent the results of Kennicutt Kennicutt (1998). The purple points represent the results for the selected box within our work. The red, magenta, cyan, blue, and orange points represent the average values of the results for each galaxy within our work. The solid pink line shows the fitting result of the data points obtained from this work and normal galaxies obtained from Kennicutt (1998), and the dashed pink line shows the fitting result of typical KS law.
Current usage metrics show cumulative count of Article Views (full-text article views including HTML views, PDF and ePub downloads, according to the available data) and Abstracts Views on Vision4Press platform.
Data correspond to usage on the plateform after 2015. The current usage metrics is available 48-96 hours after online publication and is updated daily on week days.
Initial download of the metrics may take a while.