Fig. 6.
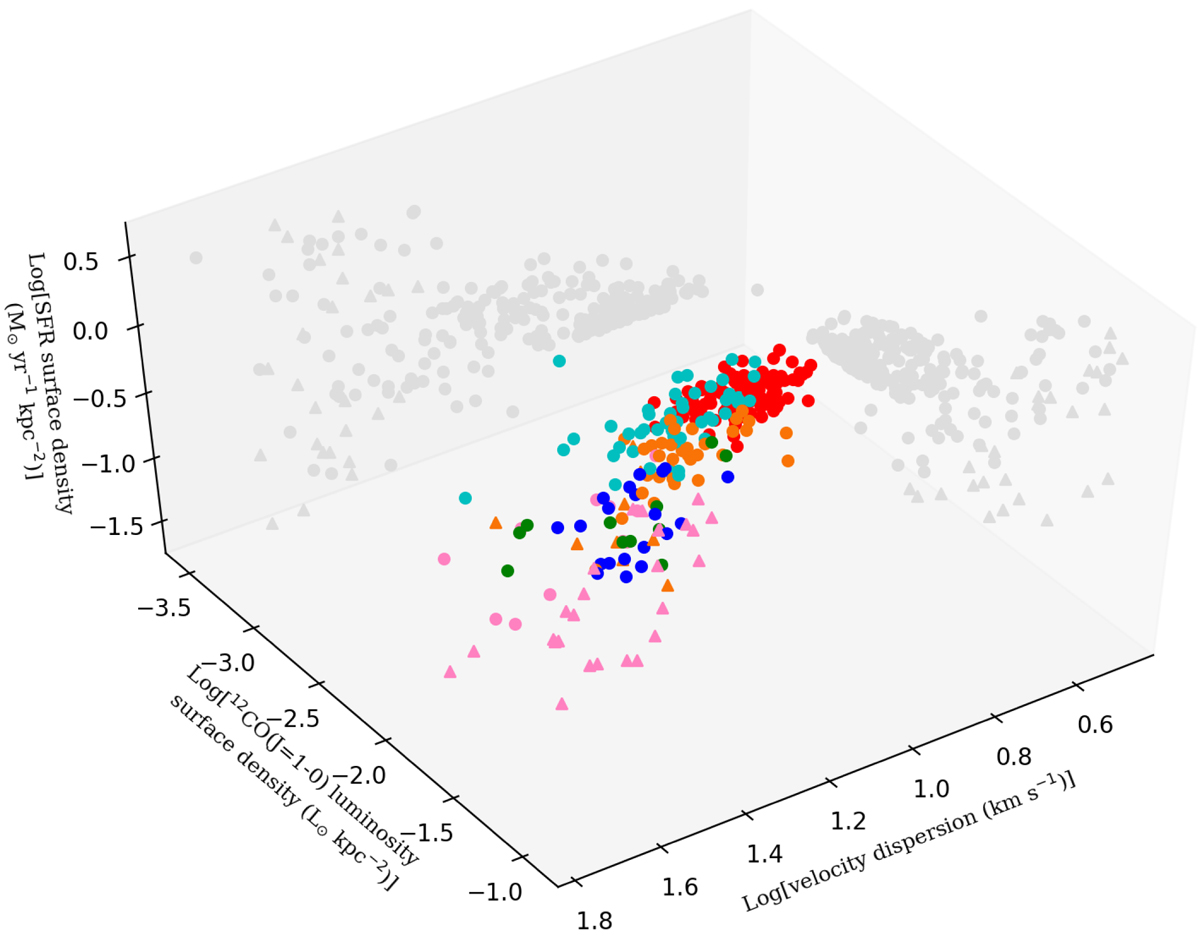
SFR surface density as a function of the velocity dispersion and 12CO(J = 1 − 0) luminosity surface density. Different galaxies are marked in different colors as shown in Fig. 4. The gray points are the projected data on the SFR surface density-CO luminosity surface density and SFR surface density-velocity dispersion planes.
Current usage metrics show cumulative count of Article Views (full-text article views including HTML views, PDF and ePub downloads, according to the available data) and Abstracts Views on Vision4Press platform.
Data correspond to usage on the plateform after 2015. The current usage metrics is available 48-96 hours after online publication and is updated daily on week days.
Initial download of the metrics may take a while.