Fig. 4.
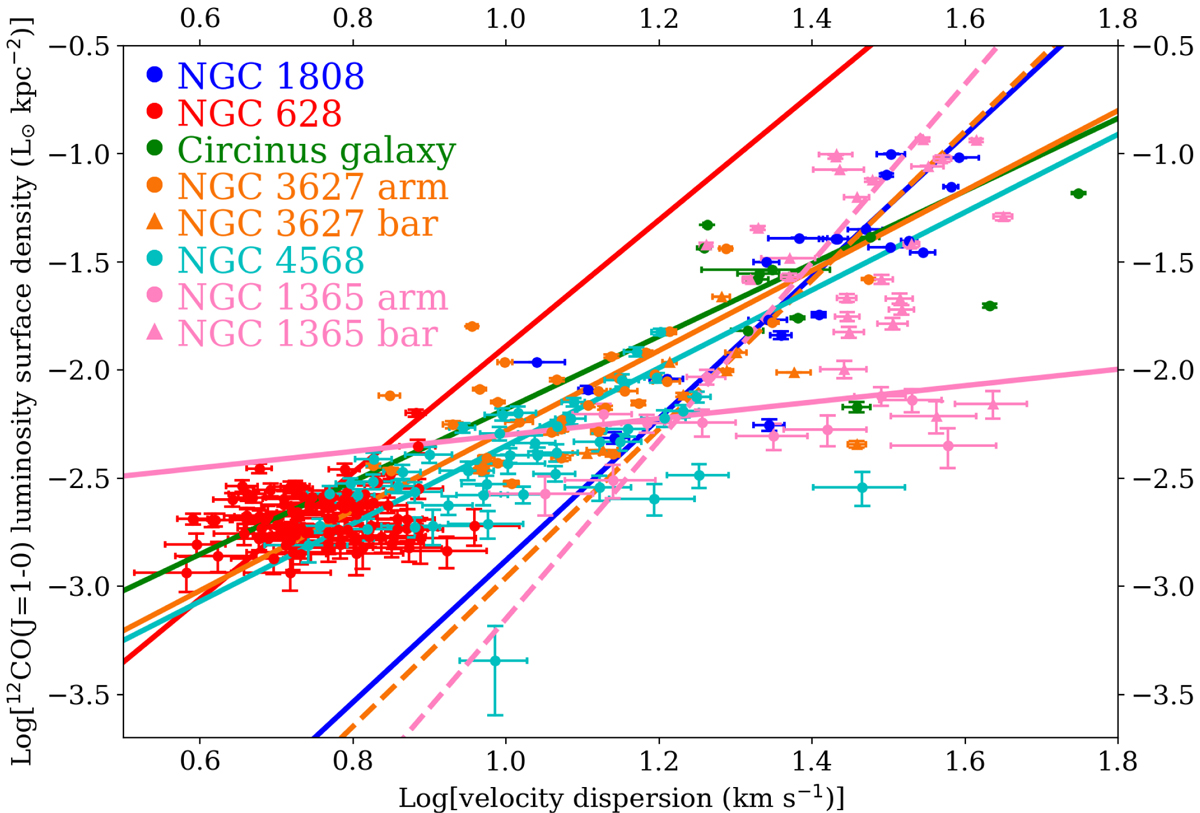
Relation of the velocity dispersion and 12CO(J = 1 − 0) luminosity surface density. Different galaxies are marked in different colors as shown in the legend. The orthogonal distance regression fittings for different galaxies are displayed as straight lines in different colors. The solid pink circles and the solid pink line of NGC 1365 show the data and the fitting result from the arm region, respectively, and the solid pink triangles and the dashed pink line display the data and the fitting result from the bar region, respectively. The solid orange circles and the solid orange line of NGC 3627 show the data and the fitting result from the arm region, respectively, and the solid orange triangles and the dashed orange line display the data and the fitting result from the bar region, respectively.
Current usage metrics show cumulative count of Article Views (full-text article views including HTML views, PDF and ePub downloads, according to the available data) and Abstracts Views on Vision4Press platform.
Data correspond to usage on the plateform after 2015. The current usage metrics is available 48-96 hours after online publication and is updated daily on week days.
Initial download of the metrics may take a while.