Fig. 1.
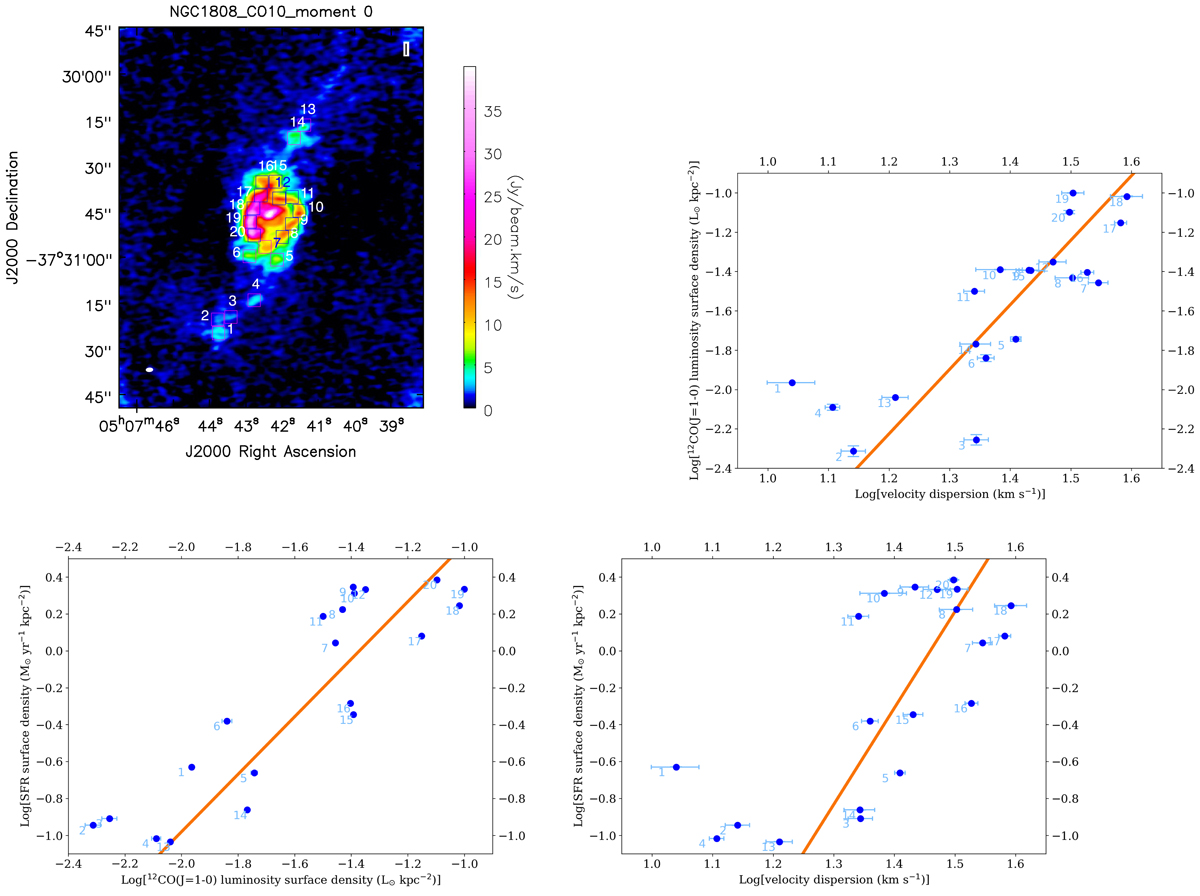
Using NGC 1808 as an example in our data analysis. Top left: 12CO(J = 1 − 0) moment 0 map of NGC 1808. Top right: relation of the velocity dispersion and 12CO(J = 1 − 0) luminosity surface density of NGC 1808. Bottom left: relation of the 12CO(J = 1 − 0) luminosity surface density and SFR surface density of NGC 1808. Bottom right: relation of the velocity dispersion and SFR surface density of NGC 1808. Different star-formation regions are marked in different numbers. The orthogonal distance regression fittings for different relations are displayed in orange lines.
Current usage metrics show cumulative count of Article Views (full-text article views including HTML views, PDF and ePub downloads, according to the available data) and Abstracts Views on Vision4Press platform.
Data correspond to usage on the plateform after 2015. The current usage metrics is available 48-96 hours after online publication and is updated daily on week days.
Initial download of the metrics may take a while.