Fig. 5
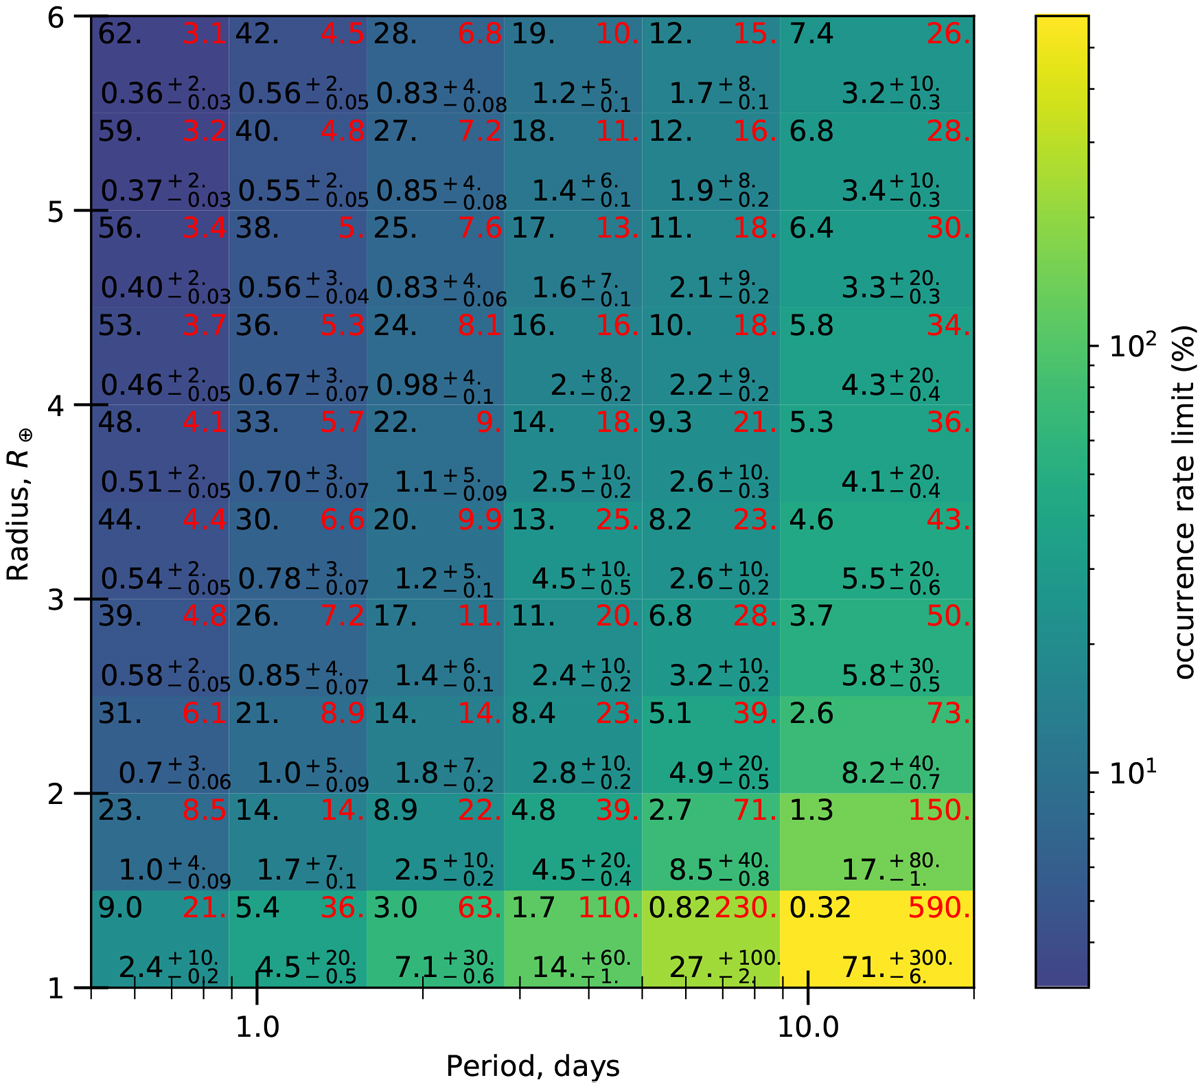
Inferred occurrence rate as a percentage of our sample as a function of (Rp, log P). Within each bin, the numbers refer to the following quantities: top right: upper bound in 95% credible interval, i.e. the 95th percentile; top left: expected number of detections given an occurrence rate η = 1 within the bin, equal to ![]() ; bottom: median and 84% credible intervals of the occurrence rate.
; bottom: median and 84% credible intervals of the occurrence rate.
Current usage metrics show cumulative count of Article Views (full-text article views including HTML views, PDF and ePub downloads, according to the available data) and Abstracts Views on Vision4Press platform.
Data correspond to usage on the plateform after 2015. The current usage metrics is available 48-96 hours after online publication and is updated daily on week days.
Initial download of the metrics may take a while.