Fig. 4
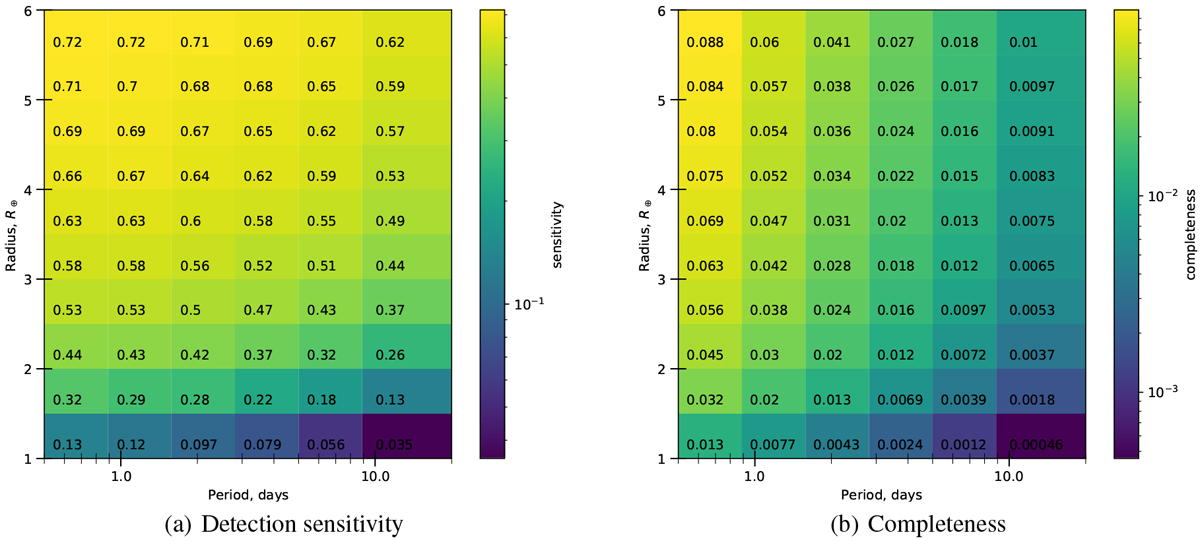
Left: detection sensitivity, showing the chance of finding a planet in the data given that it is transiting, shown as a function of planet radius and orbital period. Right: completeness, showing the chance of finding a planet with a random orbital alignment. In both cases, we integrate over the entire sample of 702 stars, thus showing the mean of the sensitivity or completeness across our entire sample. For example, if TRAPPIST-1b (R =1.086, P =1.51d, Gillon et al. 2017) were orbiting a random star in our sample, we would have a 0.77% chance of finding it given a random inclination, or a 12% chance of detecting it if it was transiting.
Current usage metrics show cumulative count of Article Views (full-text article views including HTML views, PDF and ePub downloads, according to the available data) and Abstracts Views on Vision4Press platform.
Data correspond to usage on the plateform after 2015. The current usage metrics is available 48-96 hours after online publication and is updated daily on week days.
Initial download of the metrics may take a while.