Fig. 3
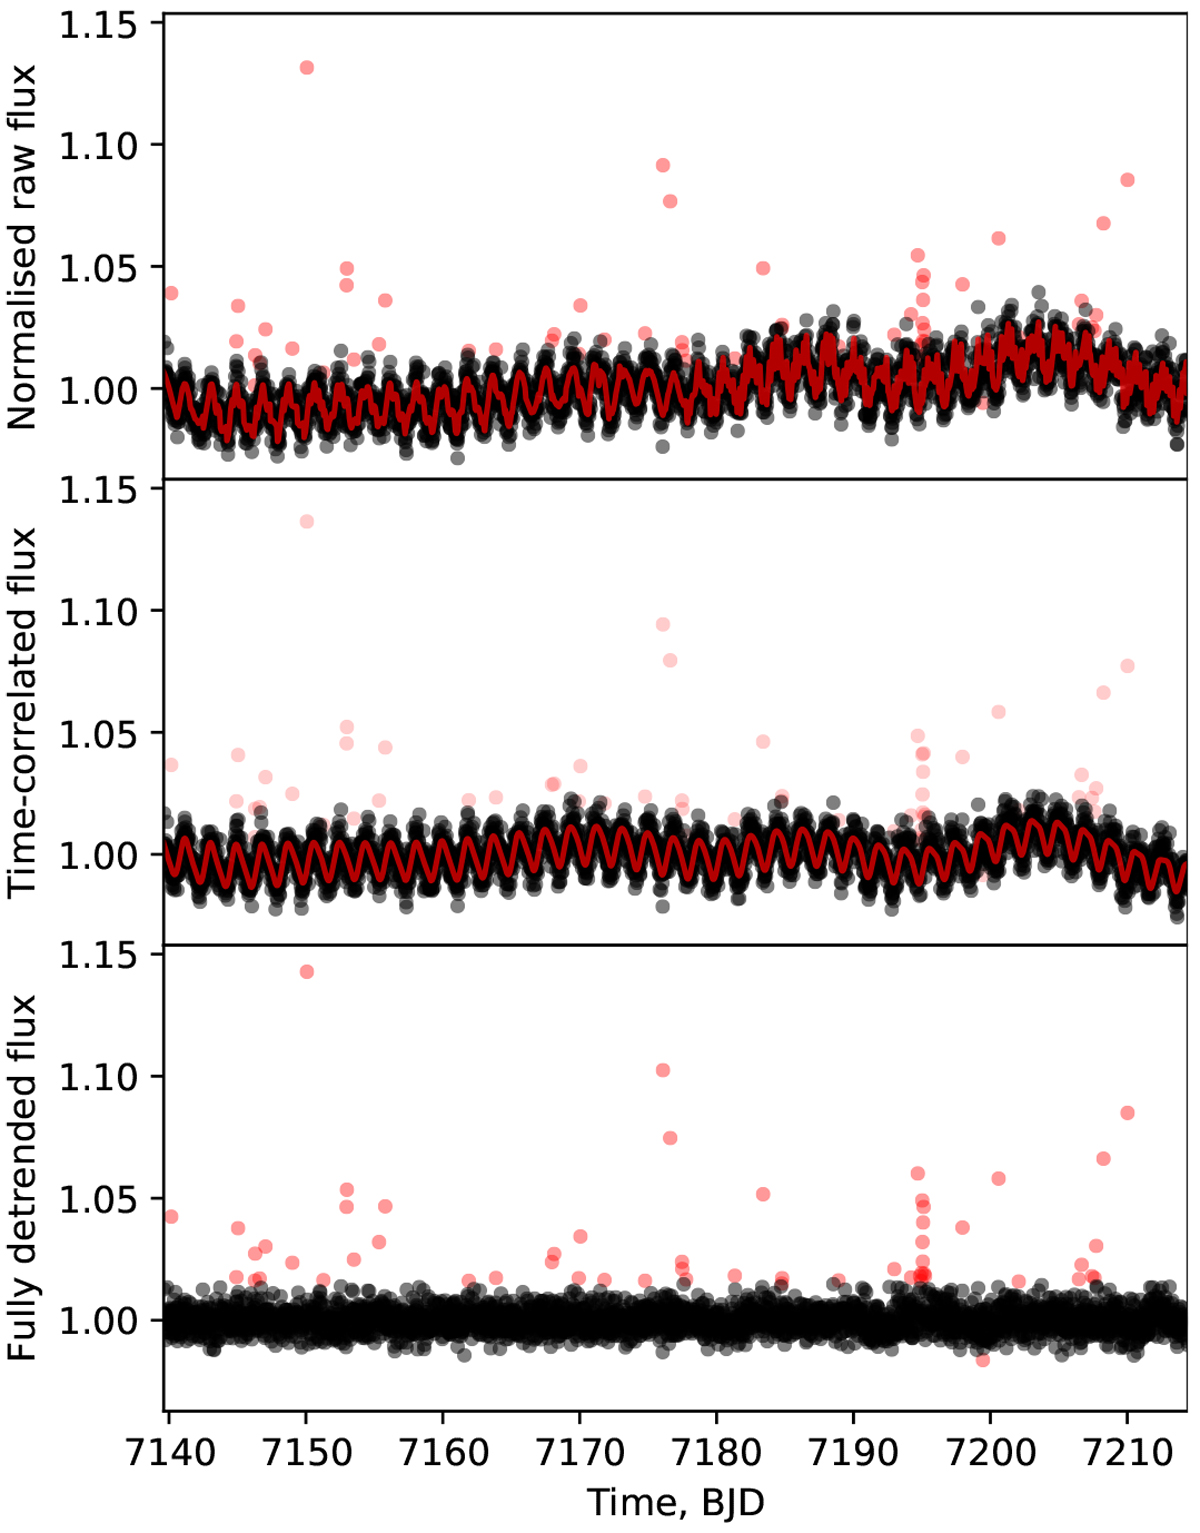
Example of the detrending procedure for target EPIC 212035051 in campaign 5. The improvement in the flux standard deviation is from 0.008 for the raw light curve to 0.004 for the detrended light curve. Top: raw flux. Middle: time-correlated component, mostly quasiperiodic stellar variability, with pointing drift noise removed. Bottom: detrended light curve on which we perform the transit search. Red points are outliers at more than 3 standard deviations from the trend. They are masked out during the detrending; i.e. we do not use them to predict the noise trend.
Current usage metrics show cumulative count of Article Views (full-text article views including HTML views, PDF and ePub downloads, according to the available data) and Abstracts Views on Vision4Press platform.
Data correspond to usage on the plateform after 2015. The current usage metrics is available 48-96 hours after online publication and is updated daily on week days.
Initial download of the metrics may take a while.