Fig. 7
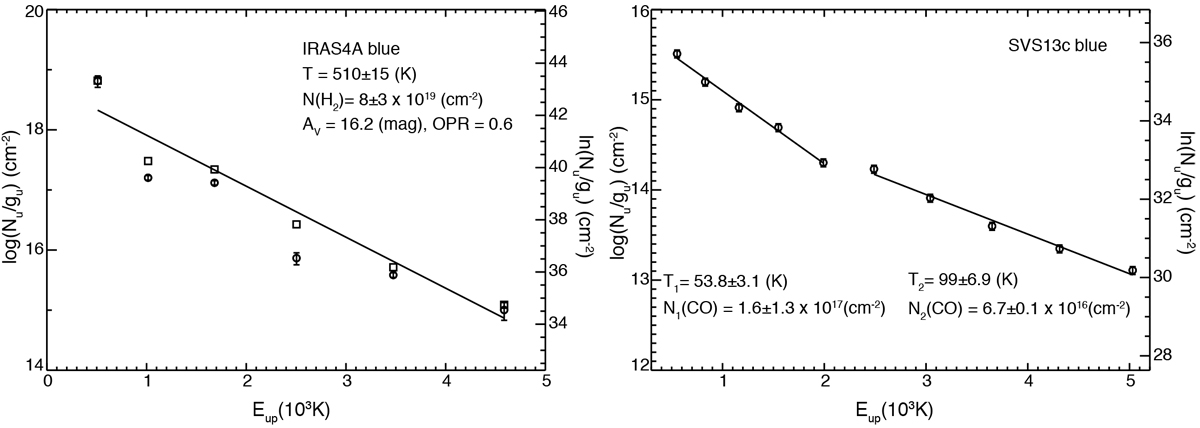
Left: excitation diagram for H2; observations(open circles) are fit to calculate the temperature and column density after dereddening (open squares) The distribution of data points can be well approximated with a single temperature component. Right: excitation diagram for CO, where the distribution of data points is best fit with a two distinct temperature components. Excitation diagrams for all outflow regions are presented in Fig. A.3.
Current usage metrics show cumulative count of Article Views (full-text article views including HTML views, PDF and ePub downloads, according to the available data) and Abstracts Views on Vision4Press platform.
Data correspond to usage on the plateform after 2015. The current usage metrics is available 48-96 hours after online publication and is updated daily on week days.
Initial download of the metrics may take a while.