Fig. 5
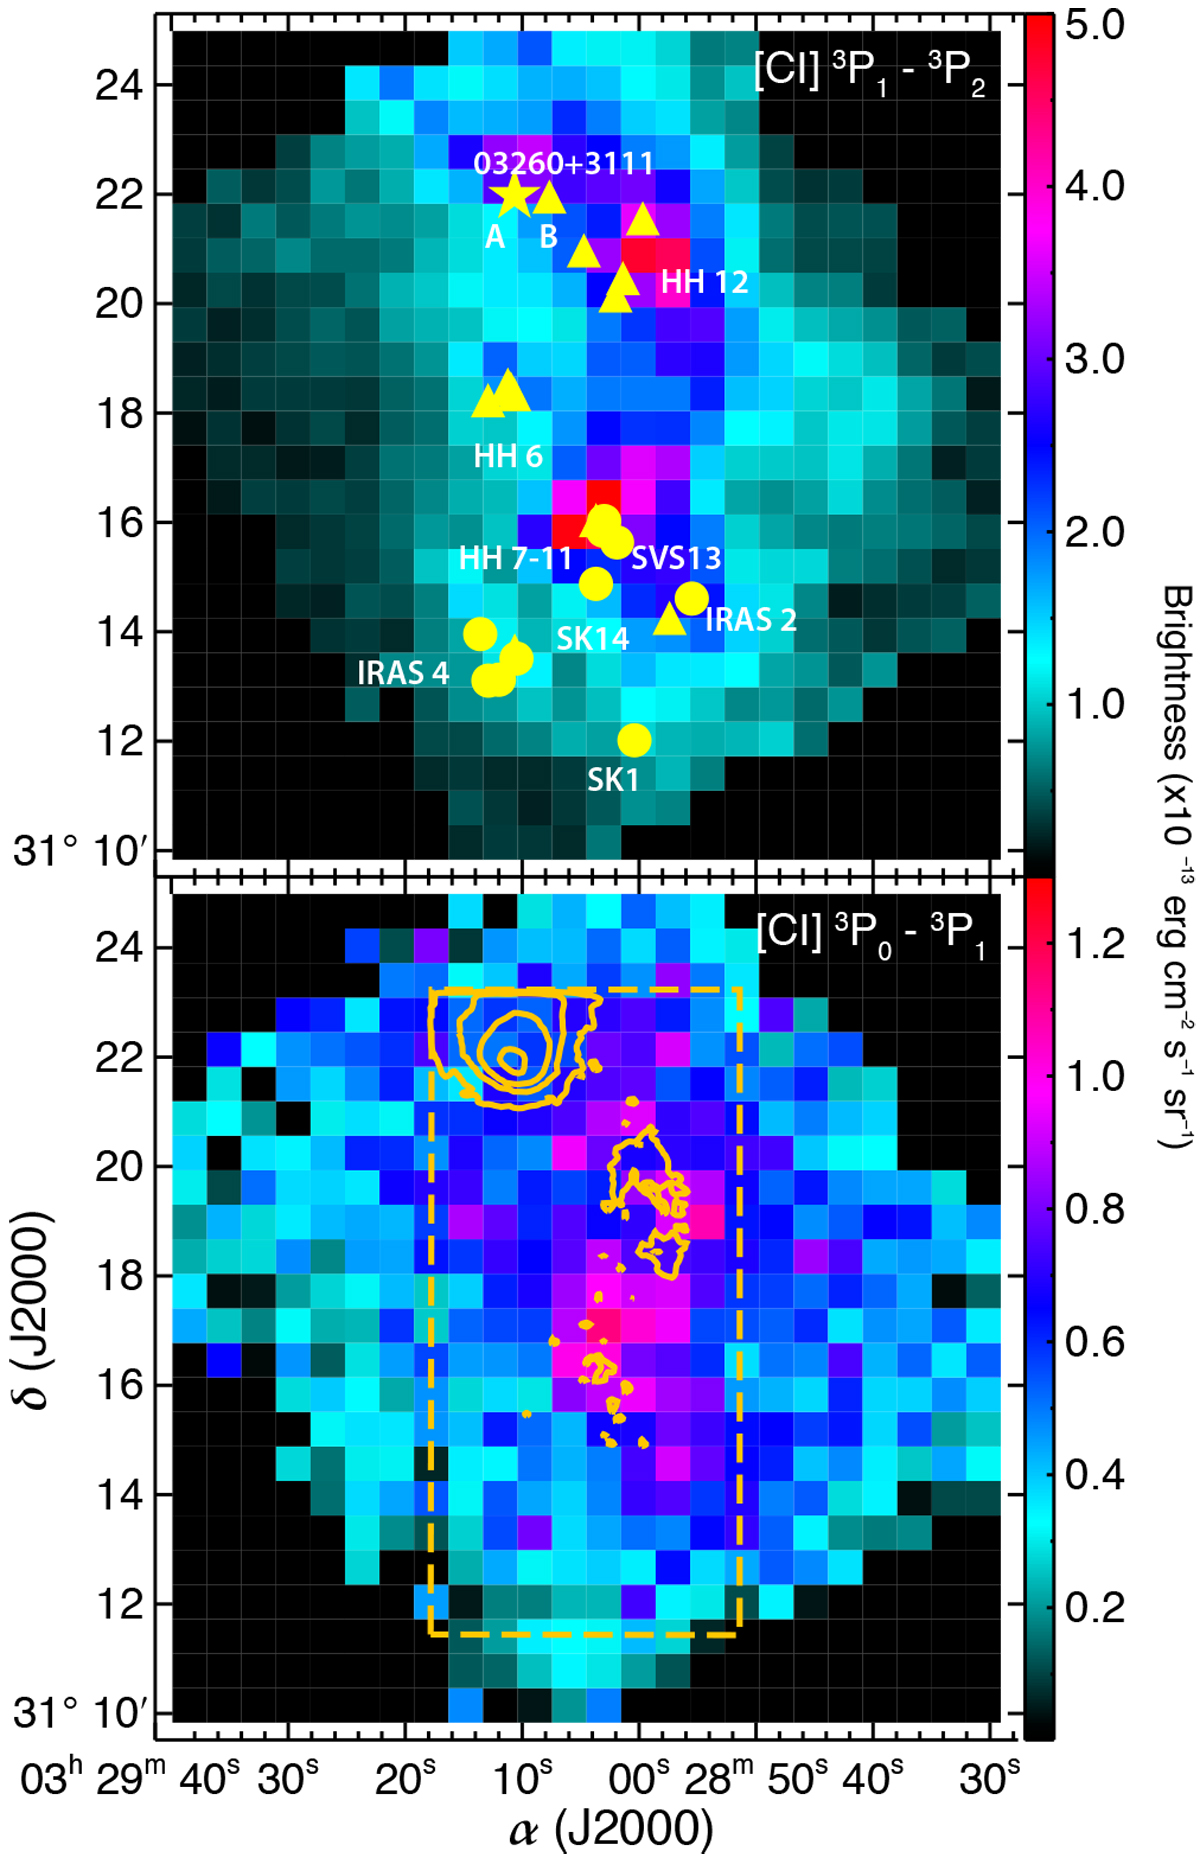
SPIRE maps of the lowest energy transitions of [C I] observed with the long-wavelength module. Upper panel: map corresponding to the fundamental transition [C I] (3P0–3P1) at 610 μm; lower panel: map corresponding to the first transition (3P1–3P2) centered at 370.4 μm (~492 and 809 GHz respectively). To enable comparisons, the [C II] emission from Paper I is superimposed in the lower panel (orange contours).
Current usage metrics show cumulative count of Article Views (full-text article views including HTML views, PDF and ePub downloads, according to the available data) and Abstracts Views on Vision4Press platform.
Data correspond to usage on the plateform after 2015. The current usage metrics is available 48-96 hours after online publication and is updated daily on week days.
Initial download of the metrics may take a while.