Free Access
Fig. 5.
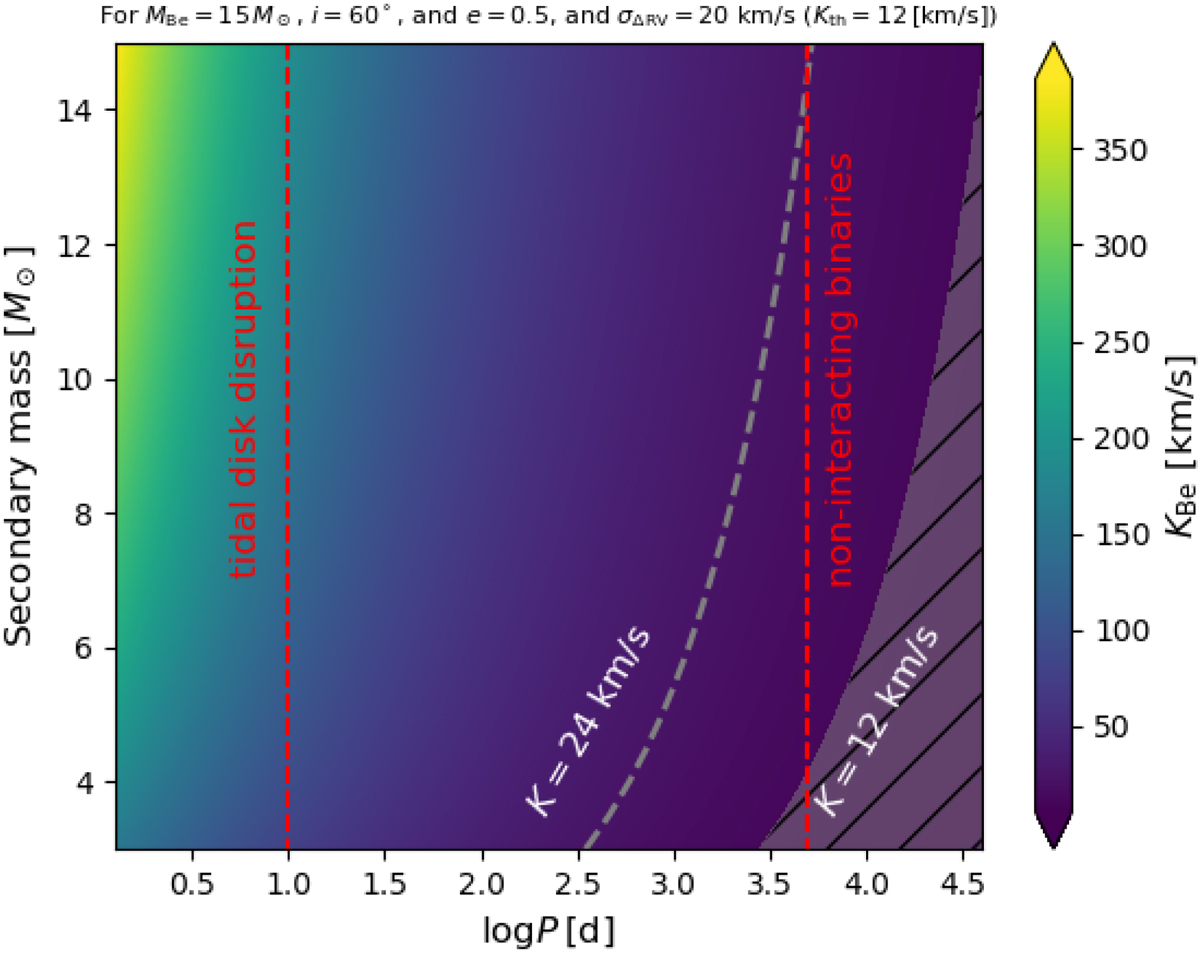
Sensitivity map of multi-epoch spectroscopic surveys. Color depicts the RV amplitude of a 15 M⊙ Be star in a binary with i = 60° and e = 0.5 as a function of the orbital period and secondary mass. Over-plotted are contours for KBe = 12, 24 km s−1 (see text).
Current usage metrics show cumulative count of Article Views (full-text article views including HTML views, PDF and ePub downloads, according to the available data) and Abstracts Views on Vision4Press platform.
Data correspond to usage on the plateform after 2015. The current usage metrics is available 48-96 hours after online publication and is updated daily on week days.
Initial download of the metrics may take a while.