Fig. 7.
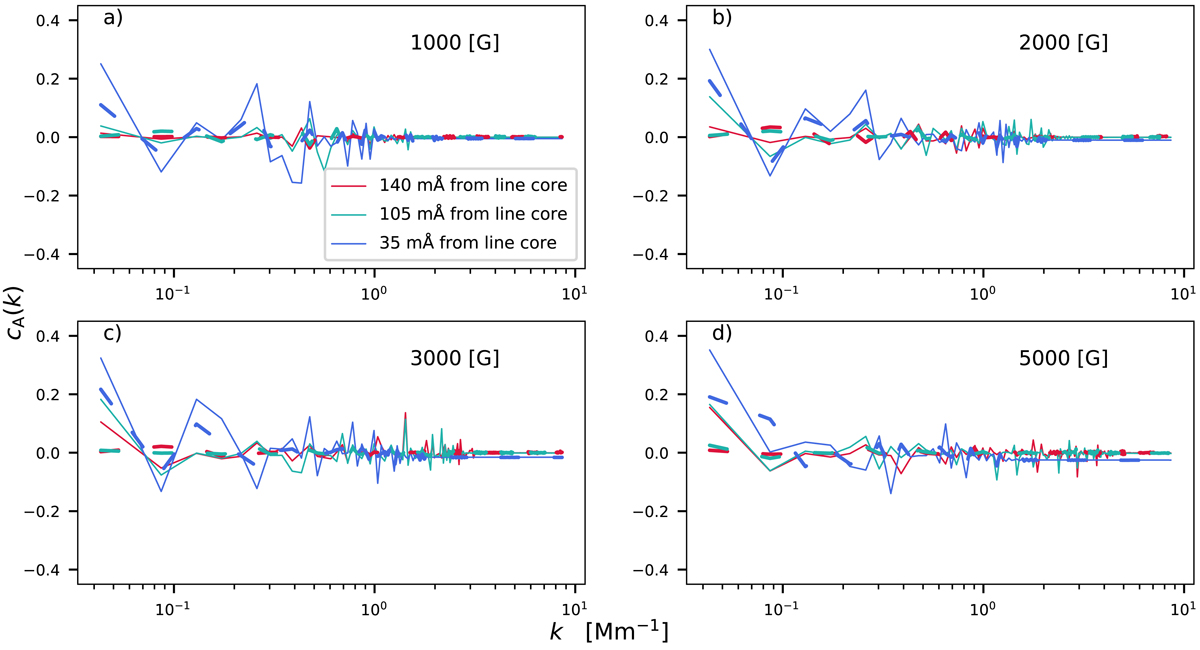
![]() calculated from Stokes Q and U for the synthetic test cases. The four panels correspond to different field strengths. The solid lines are for the spot-like configuration at the disk center. The dot-dashed lines are for the spot configuration at 30° latitude on the solar disk. For all the synthetic cases, we chose to assign the plate scale of HMI – hence the abscissa is in Mm−1.
calculated from Stokes Q and U for the synthetic test cases. The four panels correspond to different field strengths. The solid lines are for the spot-like configuration at the disk center. The dot-dashed lines are for the spot configuration at 30° latitude on the solar disk. For all the synthetic cases, we chose to assign the plate scale of HMI – hence the abscissa is in Mm−1.
Current usage metrics show cumulative count of Article Views (full-text article views including HTML views, PDF and ePub downloads, according to the available data) and Abstracts Views on Vision4Press platform.
Data correspond to usage on the plateform after 2015. The current usage metrics is available 48-96 hours after online publication and is updated daily on week days.
Initial download of the metrics may take a while.