Open Access
Fig. 3.
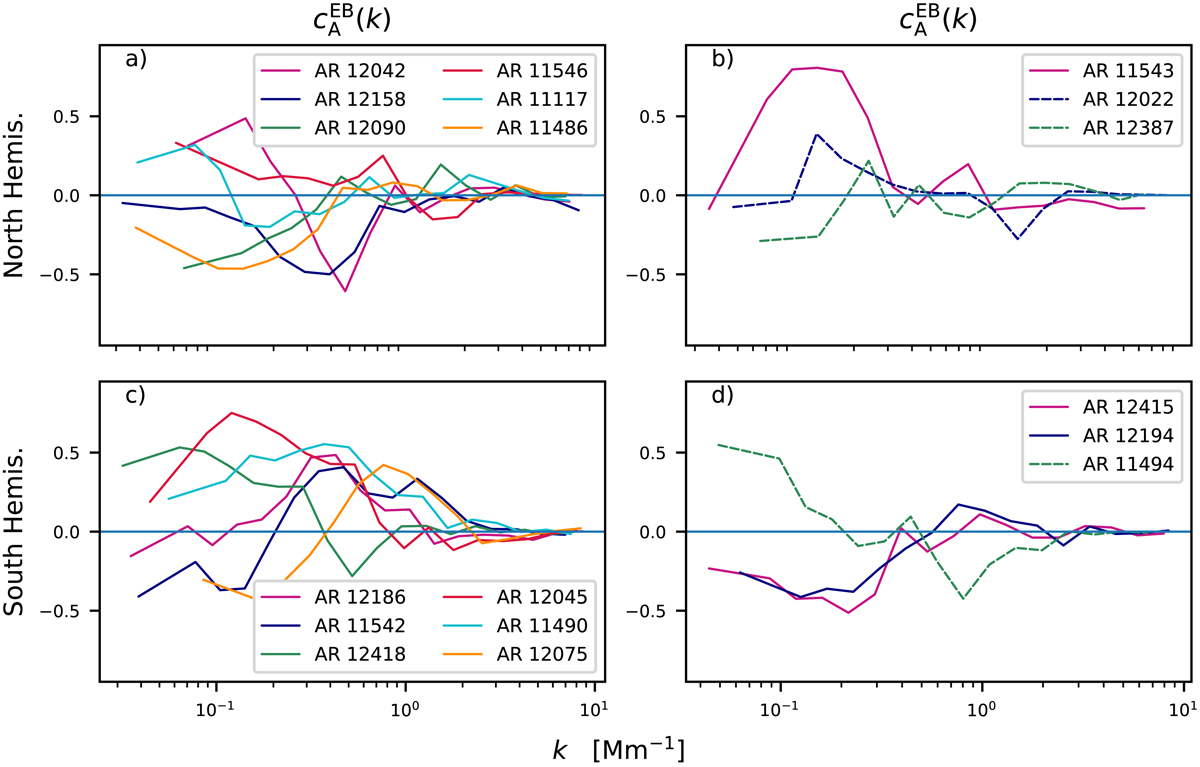
![]() for ARs of categories A (left column), B (right column, solid lines), and C (right column, dashed lines), with E and B being calculated from the components of the magnetic field vector. The curves for
for ARs of categories A (left column), B (right column, solid lines), and C (right column, dashed lines), with E and B being calculated from the components of the magnetic field vector. The curves for ![]() are smoothed in logarithmically spaced bins, for better visibility.
are smoothed in logarithmically spaced bins, for better visibility.
Current usage metrics show cumulative count of Article Views (full-text article views including HTML views, PDF and ePub downloads, according to the available data) and Abstracts Views on Vision4Press platform.
Data correspond to usage on the plateform after 2015. The current usage metrics is available 48-96 hours after online publication and is updated daily on week days.
Initial download of the metrics may take a while.