Fig. 9
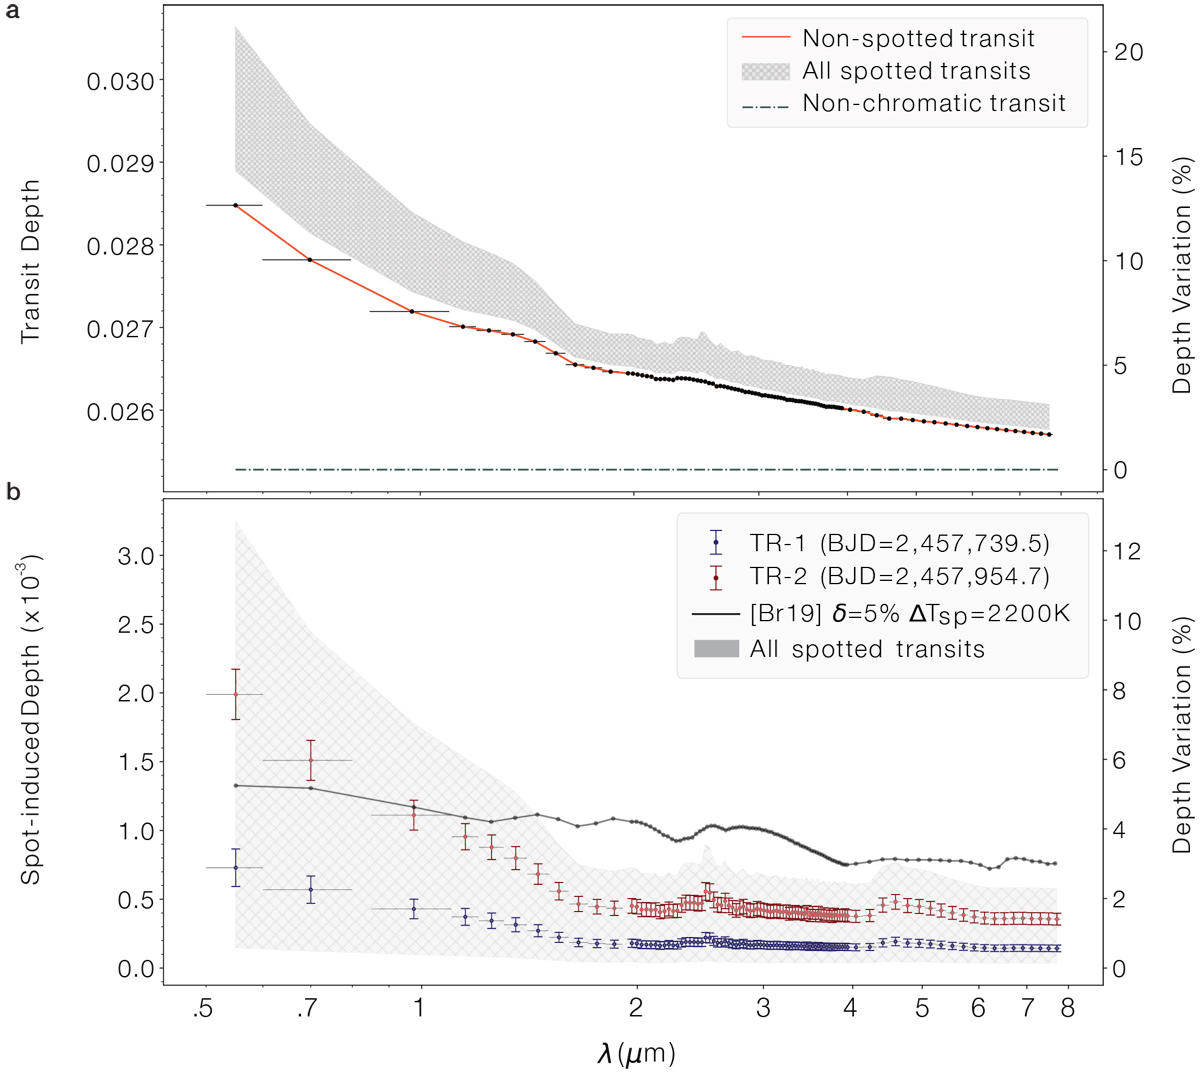
(a) Transit depth as a function of wavelength for the WASP-52 system simulated assuming an immaculate surface (red) and including spots in the photosphere (gray band), avoiding transit spot crossings. The gray area illustrates the total coverage from all simulated transits for the 21 optimal spot configurations, clearly showing the transit depth chromatic bias produced bynon-occulted spots. The dotted blue line is the non-chromatic transit depth assuming a uniform photosphere (![]() ) according tothe parameters in Öztürk & Erdem (2019). (b) Chromatic signature on transit depths due to spots after subtracting limb-darkening effect (in red in top panel). TR-1 and TR-2 show two example transits corresponding to low- and high-activity – marked with vertical lines in Fig. 8 – respectively, and the gray band represents the area covered by all simulated transits. The black solid line with symbols shows the chromatic effect estimated using stellar spot parameters derived by Bruno et al. (2020).
) according tothe parameters in Öztürk & Erdem (2019). (b) Chromatic signature on transit depths due to spots after subtracting limb-darkening effect (in red in top panel). TR-1 and TR-2 show two example transits corresponding to low- and high-activity – marked with vertical lines in Fig. 8 – respectively, and the gray band represents the area covered by all simulated transits. The black solid line with symbols shows the chromatic effect estimated using stellar spot parameters derived by Bruno et al. (2020).
Current usage metrics show cumulative count of Article Views (full-text article views including HTML views, PDF and ePub downloads, according to the available data) and Abstracts Views on Vision4Press platform.
Data correspond to usage on the plateform after 2015. The current usage metrics is available 48-96 hours after online publication and is updated daily on week days.
Initial download of the metrics may take a while.