Fig. 8
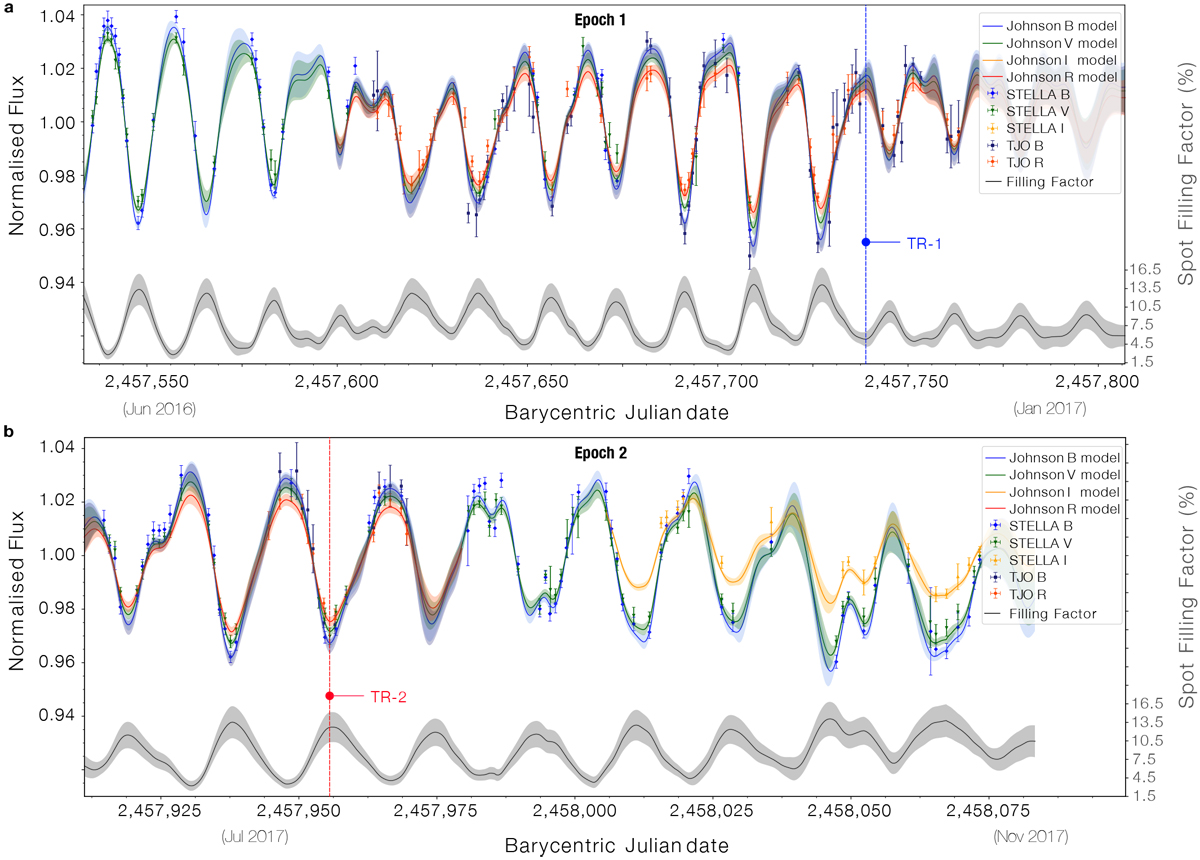
StarSim model fits to multiband photometric ground-based observational data as described. Solid curves represent the mean of 21 optimal solutions of the inverse problem. The shaded bands indicate the 1σ ranges. The gray line at the bottom is the projected spot filling factor of the maps, also showing the mean and 1σ ranges. TR1and TR2 indicate transit events as discussed in Sect. 4.
Current usage metrics show cumulative count of Article Views (full-text article views including HTML views, PDF and ePub downloads, according to the available data) and Abstracts Views on Vision4Press platform.
Data correspond to usage on the plateform after 2015. The current usage metrics is available 48-96 hours after online publication and is updated daily on week days.
Initial download of the metrics may take a while.