Fig. 7
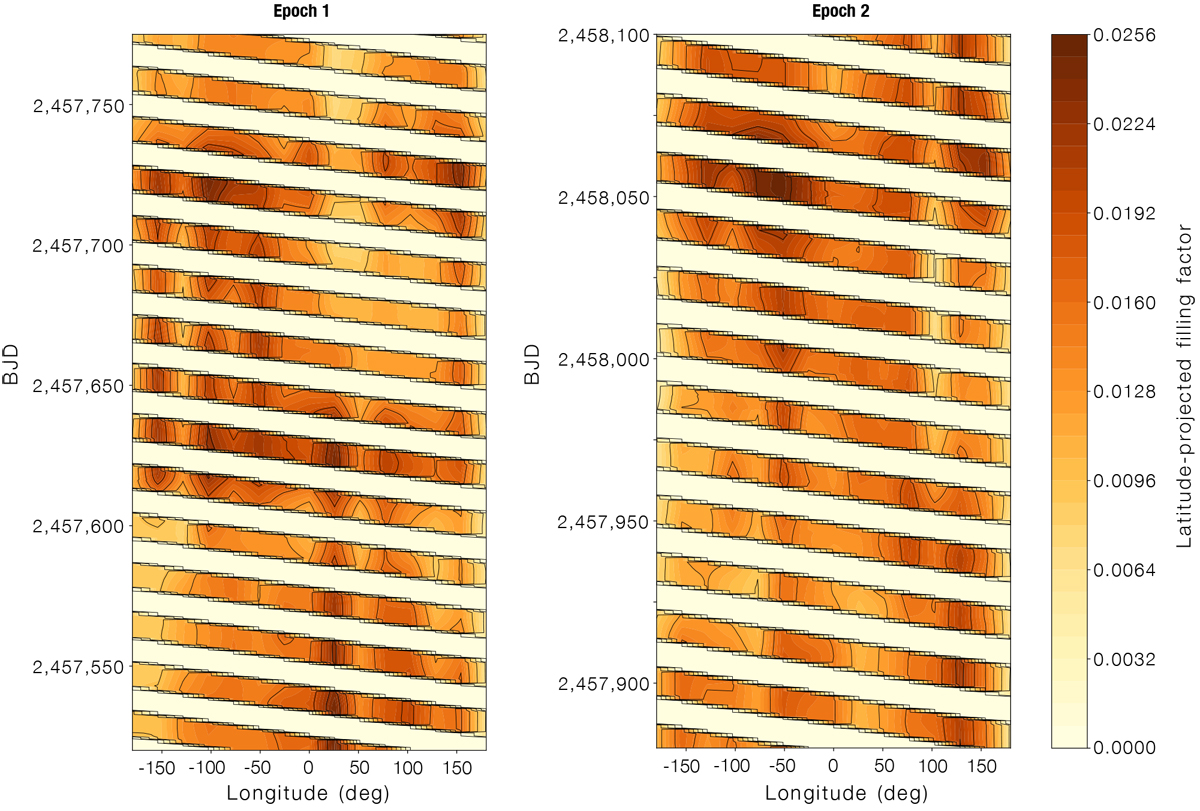
Longitudinal spot filling factor projected on the stellar equator of WASP-52 as a function of time, covering photometricepochs in 2016 and 2017 and corresponding to the average of 21 optimal solutions. Only stellar longitudes visible at each time are shown (hence the band structure). The colour scale indicates the fractional latitude-projected spot coverage for each 15-degree longitude bin.
Current usage metrics show cumulative count of Article Views (full-text article views including HTML views, PDF and ePub downloads, according to the available data) and Abstracts Views on Vision4Press platform.
Data correspond to usage on the plateform after 2015. The current usage metrics is available 48-96 hours after online publication and is updated daily on week days.
Initial download of the metrics may take a while.