Fig. 5
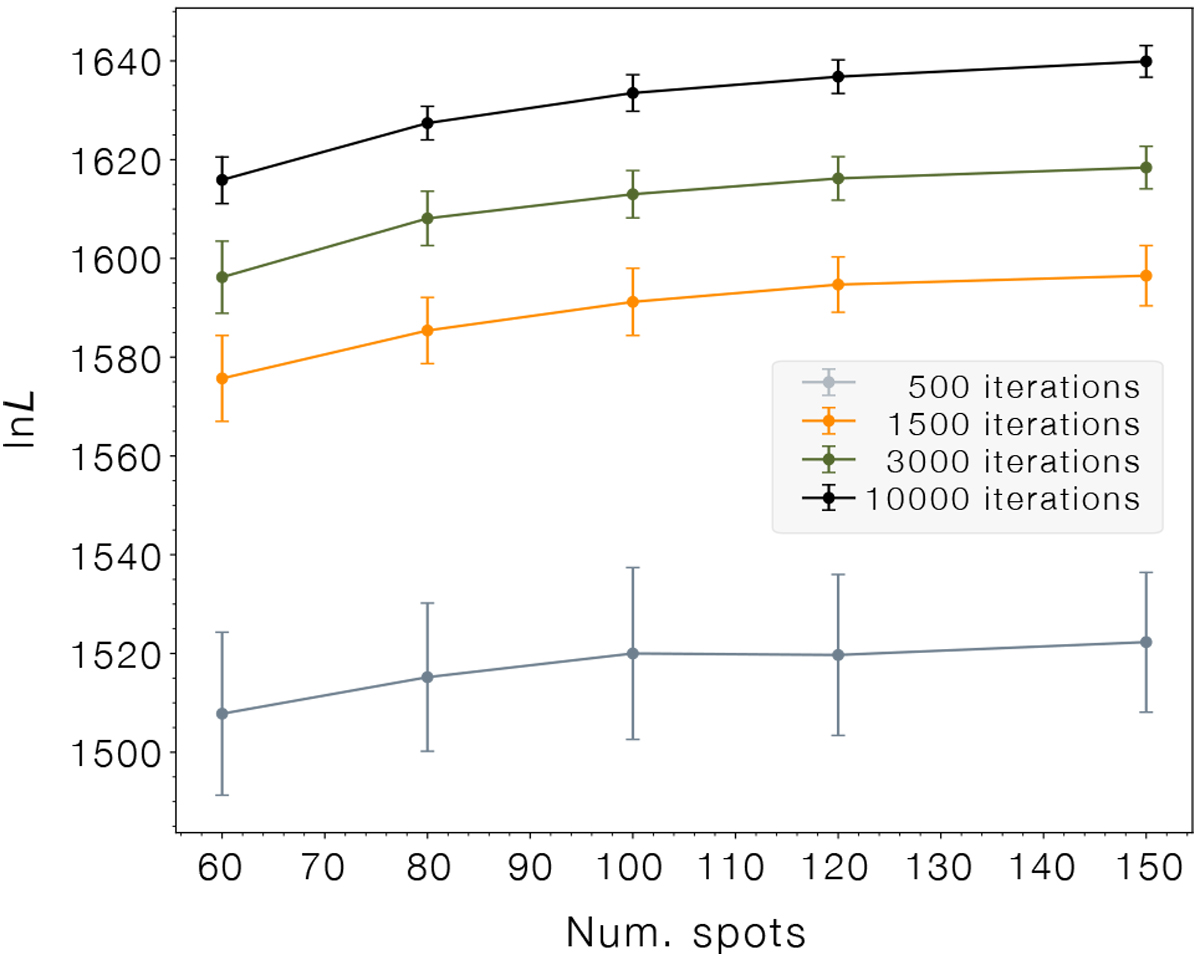
Trial tests showing the statistic ![]() as a function of the number of spots and for several values of the number of iterations of the MCSA algorithm. The size of the error bars corresponds to the 1-sigma intervals around the optimal solutions found from 112 random initial spot maps, except for the case with 10 000 iterations, where we employed 56.
as a function of the number of spots and for several values of the number of iterations of the MCSA algorithm. The size of the error bars corresponds to the 1-sigma intervals around the optimal solutions found from 112 random initial spot maps, except for the case with 10 000 iterations, where we employed 56.
Current usage metrics show cumulative count of Article Views (full-text article views including HTML views, PDF and ePub downloads, according to the available data) and Abstracts Views on Vision4Press platform.
Data correspond to usage on the plateform after 2015. The current usage metrics is available 48-96 hours after online publication and is updated daily on week days.
Initial download of the metrics may take a while.