Fig. 4
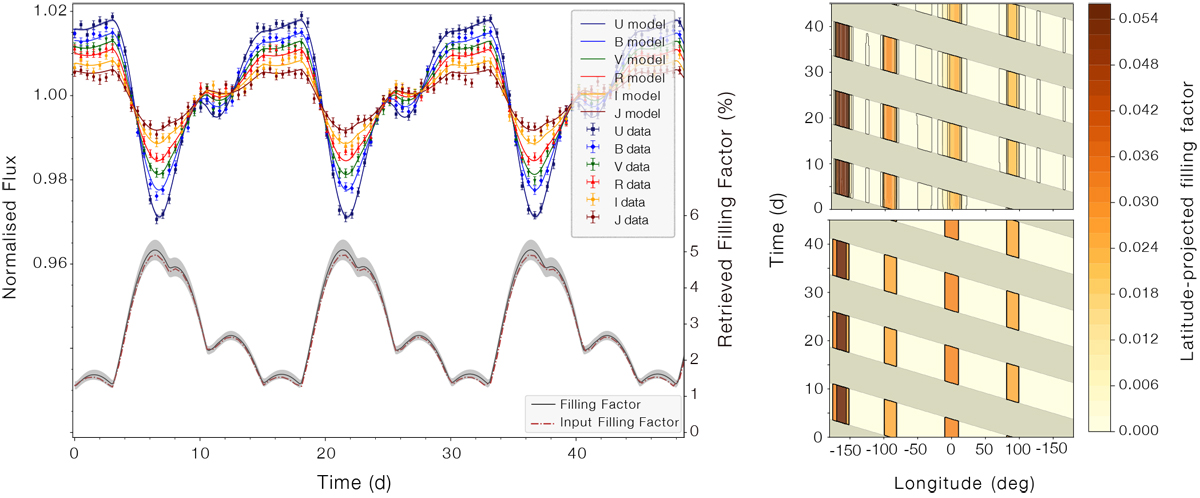
Left panel: StarSim model fits to multiband synthetic light curves assuming the parameters in Table 1, for a subset of 50 days. Solid curves represent the mean of ~20 optimal solutions of the inverse problem. The gray line at the bottom is the projected spot filling factor of the maps, also showing the mean and 1σ shaded band. The error intervals of the photometry bands are very small and difficult to recognise. Right panels: longitudinal spot filling factor projected on the stellar equator as a function of time, for both the input (bottom) and the retrieved (top) spot maps. Only stellar longitudes visible at each time are shown (hence the band structure). The colour scale indicates the fractional latitude-projected spot coverage for each 1-degree longitude bin.
Current usage metrics show cumulative count of Article Views (full-text article views including HTML views, PDF and ePub downloads, according to the available data) and Abstracts Views on Vision4Press platform.
Data correspond to usage on the plateform after 2015. The current usage metrics is available 48-96 hours after online publication and is updated daily on week days.
Initial download of the metrics may take a while.